
Uploaded by
oke
56 SLIDES
674 VUES
560LIKES
Interactive Visualization of Figures and Boxes: An Insight into Data Presentation
DESCRIPTION
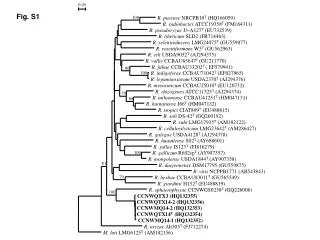
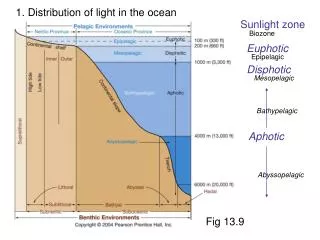
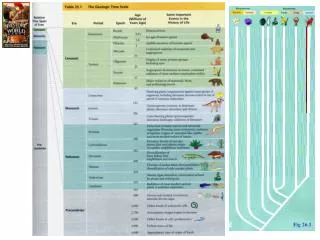
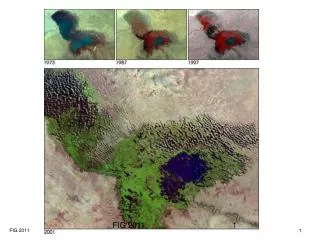
This interactive collection features a comprehensive series of figures (Fig. 12.1 to Fig. 12.34) and informative boxes (Box 12.2.1, Box 12.7.1) that visually represent a wide range of data and concepts. Each figure serves a specific purpose in illustrating ideas, trends, and relationships in the data. The integration of these visual tools enhances understanding and retention of complex information. Explore various graphical formats to grasp the underlying principles effectively and engage with the data for deeper insights.
Download

1 / 56
Télécharger la présentation 
Interactive Visualization of Figures and Boxes: An Insight into Data Presentation
An Image/Link below is provided (as is) to download presentation
Download Policy: Content on the Website is provided to you AS IS for your information and personal use and may not be sold / licensed / shared on other websites without getting consent from its author.
Content is provided to you AS IS for your information and personal use only.
Download presentation by click this link.
While downloading, if for some reason you are not able to download a presentation, the publisher may have deleted the file from their server.
During download, if you can't get a presentation, the file might be deleted by the publisher.
E N D
Presentation Transcript


More Related