Nutritional Information
Nutritional Information. ERT 426 Food Engineering Semester 1 Academic Session 2014/15. Subtopics. Nutritional Status How is Nutritional Status Assessed? Food Composition Tables and Dietary Analysis How much of a nutrient is adequate? Assessment of Energy Intake.

Nutritional Information
E N D
Presentation Transcript
Nutritional Information ERT 426 Food Engineering Semester 1 Academic Session 2014/15
Subtopics • Nutritional Status • How is Nutritional Status Assessed? • Food Composition Tables and Dietary Analysis • How much of a nutrient is adequate? • Assessment of Energy Intake. • How to easily assess and plan a person’s diet? • How to use food labels to plan a healthy diet? ERT 426 Food Engineering
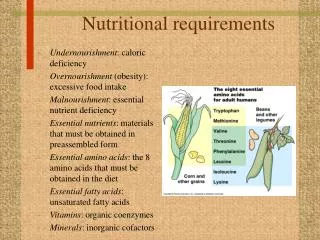
1. Nutritional status • Most people know that not getting enough of the essential nutrients can lead to suboptimal physiological function and undesirable long term health outcomes. • Consuming too little of a nutrient, a situation called undernutrition can cause nutritional deficiency , which can be serious and sometimes fatal. • Consuming too many fatty foods can lead to obesity – it is related to health consequences. • overconsumption of some vitamins and minerals can be fatal - nutritional toxicity. ERT 426 Food Engineering
Nutritional status • Undernutrition and overnutrition make up the extreme ends of what is called the nutritional status continuum. • both are examples of malnutrition. • Malnutrition is defined as a state of poor nutrition due to an imbalance between the body’s nutrient requirements and nutrient consumption. ERT 426 Food Engineering
Nutritional status Nutrient Intake Largely Determine Nutritional Status and Contributes to Health ERT 426 Food Engineering
Nutritional status • Primary malnutrition is due to inadequate or excess food intake. • Secondary malnutrition is caused by other factors. • For example, a person may be deficient in one of the B-vitamins • because his or her diet is lacking vitamin-rich fruits and vegetables (this is primary malnutrition) or • because an illness interferes with vitamin B absorption (this is secondary malnutrition). ERT 426 Food Engineering
2.How is nutritional status assessed? • Because adequate nutrition is required for optimal health, it is important for health care providers to be able to assess a person’s nutritional status. • In general, there are FOUR (4) ways in which nutritional status can be assessed: • Anthropometric measurements • Biochemical measurements • Clinical assessment • Dietary assessment ERT 426 Food Engineering
How is nutritional status assessed? • Although each of these types can provide some information about a person’s nutritional status, it is essential to know that each one (by itself) cannot tell everything. ERT 426 Food Engineering
How is nutritional status assessed? 1. Anthropometric measurements: • Anthropometry literally means ‘to measure the human body’. • It is a assessment of a person’s body’s physical dimensions (height, weight, circumferences) and composition (fat mass). • It is easy & inexpensive to obtain. ERT 426 Food Engineering
How is nutritional status assessed? 1.1 Physical Dimensions: • Height & weight are often used to assess the risk for certain chronic degenerative diseases, such as heart disease and type 2 diabetes. • Changes in body weight and height can provide information regarding the progression of certain diseases. • For examples, loss of height in an elderly person might indicate a decline in bone density. ERT 426 Food Engineering
How is nutritional status assessed? • Height & weight are commonly used to assess nutritional status in infancy, childhood & pregnancy. • Other physical dimensions: various circumferences such as those of the waist, hips & head. • Increase in waist and hip circumferences typically indicate altered body fat distribution. • Head circumference is frequently measured to monitor brain growth during infancy. ERT 426 Food Engineering
How is nutritional status assessed? 1.2 Body composition: • Estimation of body composition – the proportions of fat, water, lean tissue and mineral (bone) mass that make up your tissues. • How these components of your body are distributed can provide an important indicator of your nutritional status and overall health. • E.g. too much body fat can lead to cardiovascular disease and loss of bone mass is a major risk factor for osteoporosis. ERT 426 Food Engineering
How is nutritional status assessed? • Body composition measurements, are often used along with other anthropometric measurement to provide more detailed information concerning nutritional status. ERT 426 Food Engineering
How is nutritional status assessed? 2.Biochemical measurements: • These involve laboratory analysis of a biological sample, such as blood or urine. • the sample is analyzed for a specific nutrient – blood calcium levels can be measured to determine calcium status. ERT 426 Food Engineering
How is nutritional status assessed? • In other laboratory tests, the sample is analyzed for an indicator (biological marker / biomaker) that reflects the nutrient’s function. • the hemoglobin content of blood is often measured as a biological marker of iron status. • This is because hemoglobin levels decrease during iron deficiency. • Biochemical measurements are powerful because they can help diagnose a specific nutrient deficiency or excess. ERT 426 Food Engineering
How is nutritional status assessed? • Biochemical measurements are powerful because they can help diagnose a specific nutrient deficiency or excess. ERT 426 Food Engineering
How is nutritional status assessed? 3. Clinical Evaluation: • By conducting a face-to-face clinical assessment & it is usually involve a series of activities (taking medical history). • information about previous diseases, unusual weight loss &/or weight gain, surgeries, medication & family health history. ERT 426 Food Engineering
How is nutritional status assessed? • Clinical assessments are valuable in nutritional assessment because they can uncover signs and symptoms of malnutrition. • It is important for clinicians (e.g. clinical dietitians, nurses, doctors) to know the various signs & symptoms associated with nutrient deficiencies so that they can be sure to make the appropriate observations & ask the right question. ERT 426 Food Engineering
How is nutritional status assessed? 4. Dietary assessment: • Two (2) methods: • Retrospective methods – require a person to remember foods consumed in the past. • Prospective methods – require a person to keep track of which and how much food he/she consume during a specified period of time. ERT 426 Food Engineering
How is nutritional status assessed? 4.1 Retrospective methods: Recalls & Questionnaires. • In 24 hours recall method, a person must record everything that has been eaten or drunk in the previous 24hours & then analyze the information to estimate nutrient intake. • Food frequency questionnaire – typically asks for information on food intake patterns over an extended period of time. ERT 426 Food Engineering
How is nutritional status assessed? 4.2 Prospective methods: Diet records. • it is more accurate & it is better to record foods & beverages as they are consumed. • The portion sizes is estimate using standard household measurements (e.g. tablespoon or cup) or weigh the food before eat. • This information is analyzed to estimate the nutrient intake. ERT 426 Food Engineering
3.Food composition tables and Dietary analysis • After completing a dietary record, subsequently the micronutrient, macronutrient and energy (calories) contents in a diet is to be determined. • There are basically two (2) ways to find information concerning the nutrient composition of foods: • Food composition tables • Computerized nutrient database. (US Department of Agricultural website-http://www.ars.usda.gov/nutrientdata) ERT 426 Food Engineering
4.How much of a nutrient is adequate? • Different people require different amounts of nutrients depending on their sex, age, genetics, medications, lifestyle choices and environmental influences(climate). • A set of nutritional standards has been developed to help both medical professionals and interested individuals assess dietary adequacy. • Dietary Reference Intakes (DRIs): • Estimated Average Requirement (EAR) • Recommended Dietary Allowance (RDA) • Adequate Intake Level (AI) • Tolerable Upper Intake Level (UL) ERT 426 Food Engineering
How much of a nutrient is adequate? Dietary Reference Intake (DRI) standards. ERT 426 Food Engineering
How much of a nutrient is adequate? • Nutrient requirement: • the amount of a nutrient that a person must consume to promote optimal health. • In general, nutrient requirements of all the individuals in a population are distributed in a bell-shaped manner. • the vast majority of people have requirements at some mid level amount with some requiring much less and others requiring much more. • Note: DRI reference values only consider age, life- stage and sex. ERT 426 Food Engineering
How much of a nutrient is adequate? 1. Estimated average requirements (EARs): • It reflects a population’s average need. • The energy is not a nutrient, EARs for it were not established but Estimated Energy Requirement (EER) are provided (see later ). • EAR values represent the intakes thought to meet the requirements of half the healthy individuals in each particular age, life-stage & sex group. ERT 426 Food Engineering
How much of a nutrient is adequate? Estimated Average Requirements (EARs) compared with Recommended Dietary Allowance (RDSs) ERT 426 Food Engineering
How much of a nutrient is adequate? 2. Recommended Dietary Allowances (RDAs): • RDAs are used as nutrient-intake goals for individuals, in contrast to the EARs, which are geared toward assessing nutritional status of populations. • RDA values were derived directly from the EARs using mathematical equations. 3. Adequate Intake (AI) levels: • It were set when data were lacking for EARs (or RDAs). • AIs are meant to be used as nutrient intake goals for individuals. • AIs were based on intake levels that seem to maintain adequate nutritional status in healthy people. ERT 426 Food Engineering
How much of a nutrient is adequate? • Note that, since rigorous studies cannot ethically be done on young infants (0 to 6 months of age), there are no RDAs for this life-stage group, but only AIs. 4. Tolerable Upper Intake Levels (UL): • Have been established as the highest level of usual daily nutrient intake likely to be safe. • The ULs are not to be used as goals for dietary intake. _______________________________SUMMARY________________________________ • EAR, RDA, AI – to help us consume nutrients in sufficient quantities to support health. • UL – helps us avoid consuming nutrients in such large quantities that they actually do harm. ERT 426 Food Engineering
How much of a nutrient is adequate? • Table 1 : Availability Dietary Reference Intake (DRI) Standards and Acceptable Macronutrient Distribution Ranges (AMDR) values for adults.
How much of a nutrient is adequate? • Using EARs, RDSs, AIs & ULs to assess your nutrient intake: Using EARs, RDAs and ULs to assess dietary adequacy
How much of a nutrient is adequate? • When EARs, RDAs and ULs have been established: • If you intake of a nutrient (X) is: • X << EAR, it is likely to be inadequate – increasing the risk of nutrient deficiency. • EAR > X > RDA, you should probably increase your intake. • RDA > X > UL, it is probably adequate. • X > UL, it is probably too high. • When only AIs are available: • If you intake of a nutrient (X) is: • AI > X > UL, it is probably adequate. • X < AI, no conclusion. ERT 426 Food Engineering
How much of a nutrient is adequate? • Example 1: Consider a 20 years old female who, upon completing a food record and dietary assessment, learns that her vitamin A intake is 1,500 µg/day, 600 µg/day and 3,500 µg/day for January 2010, February 2010 and March 2010, respectively. For her case, RDA = 700 µg/day EAR = 500 µg/day UL = 3,000 µg/day What should be her conclusion? ERT 426 Food Engineering
5. Assessment of Energy Intake. • Energy Intake Assessment: • There are two (2) types of standards to assess the energy intake: • Estimated Energy Requirements (EERs) • Acceptable Macronutrients Distribution Ranges (AMDRs) • Estimated Energy Requirements (EERs) represent the average energy intakes needed to maintain weight in a healthy person of a particular age, sex, weight, height and physical activity level. ERT 426 Food Engineering
Assessment of Energy Intake. • EERs are calculated using mathematical equations: 1. Adult men: EER = 662 – [9.53 x Age (year)]+ PA x [15.91 x Weight (kg) + 539.6 x Height (m)] 2. Adult women: EER = 354 – [6.91 x Age (year)]+ PA x [9.36 x Weight (kg) + 726 x Height (m)] • where PA – physical activity level. ERT 426 Food Engineering
Assessment of Energy Intake. • Table 2: Physical Activity (PA) Categories and Values ERT 426 Food Engineering
Assessment of Energy Intake. Effects of Age and Activity level on Estimated Energy Requirements (EERs) ERT 426 Food Engineering
Assessment of Energy Intake. • Aside from knowing the right amount of total calories, it is important to know whether the distribution of energy sources (carbohydrates, proteins, fats) is healthy. • The Acceptable Macronutrient Distribution Ranges (AMDRs) reflects the ranges of intakes for each class of energy-yielding nutrient associated with reduced risk for chronic disease while providing adequate intakes of essential micronutrients. • AMDRs were published along with the EERs. ERT 426 Food Engineering
Assessment of Energy Intake. • Acceptable Macronutrient Distribution Ranges (AMDRs) • Carbohydrates : 45 – 65 % of total energy • Protein : 10 – 35% of total energy • Fat : 20 – 35% of total energy Note: Total energy = EER ERT 426 Food Engineering
Assessment of Energy Intake. • Student volunteer is a xx years old woman who weighs xx pounds. • She is x feet x inches (x m) tall and has a low activity level. • Calculate the EER for Student volunteer. • Propose the AMDRs for Student volunteer. ERT 426 Food Engineering
6.How to easily assess and plan a person’s diet? • Completing a dietary assessment along with DRI, EER & AMDR values can help a person to determine whether his/her nutrient and energy intakes are likely adequate. • However, this process can be rather cumbersome. • Luckily there are many additional tools available for simplifying this process. 1. Dietary guidelines (Food Guides) 2. The Food Guide Pyramid ERT 426 Food Engineering
How to easily assess and plan a person’s diet? • Dietary Guidelines (Adopted from USDA): • Consume a variety of foods within and among the basic food groups while staying within energy needs. • Control calorie intake to manage body weight. • Be physical active every day. • Increase daily intake of fruits and vegetables, whole grains and nonfat or low-fat milk and milk products. • Choose fats wisely for good health. • Choose carbohydrates wisely for good health. • Choose and prepare foods with little salt. • Keep food safe to eat Key concepts: Variety, Balance, Moderation, Nutrient Density. ERT 426 Food Engineering
How to easily assess and plan a person’s diet? • Based on a person’s calorie requirement, the recommended number of servings from each food group in the Food Guide: * Based on age, sex & physical activity level
How to easily assess and plan a person’s diet? • Food Guide Pyramid: • It is more consumer-friendly. • The pyramid shape helped to emphasize the relative contribution of each food group. • The large base of the pyramid was made up of foods of plant origin (grains, vegetables & fruits) • The smaller, upper sections of the pyramid contained food that come primarily from animals (milk, yoghurt, cheese, meat, poultry, fish & eggs). ERT 426 Food Engineering
How to easily assess and plan a person’s diet? • An example of a personalized Food Pyramid. • To create a personal pyramid plan – http://www. mypyramid. gov ERT 426 Food Engineering
7. How to use food labels to plan a healthy diet? Understanding Food Labels and Nutrition Facts Panel. ERT 426 Food Engineering
How to use food labels to plan a healthy diet? 1. Understand what is included on nutrition facts panels. • The information on a food label: • Product name & place of business • Product net weight • Product ingredient content (from most to least abundant ingredient). • Company name & address • Country of origin • Product code (UPC bar code) • Product dating or Religious symbols (if any) • Safe-handling instructions / Special warning instruction (if any) • Nutrition facts panel outlining specified nutrient information. ERT 426 Food Engineering
How to use food labels to plan a healthy diet? 2. The Nutrition Facts Panel. • The manufacturer must include the serving size of the food. • Serving sizes have been standardized for ease of comparison. • Nutrition fact panels must provide information concerning specific nutrients that the Dietary Guidelines suggest limiting. • These include total fat, saturated fat, trans fat, cholesterol and sodium. ERT 426 Food Engineering
How to use food labels to plan a healthy diet? 3. Daily values (DVs) and Percent Daily Values (%DVs): • Although Nutrition facts panels provide an impressiveamount of nutrition information – but how does a consumer know if that amount is a little or a lot? • Daily Values (DVs) and percent Daily Value (%DV) were created to give consumers a benchmark for knowing whether a food is a good source of a nutrient and allowing them to easily compare one food with another. • For example, the DV for vitamin C is 60mg/day • thus, a cereal providing 30mg of vitamin C per serving would contain half of the DV. • in other words, the food would have a %DV of 50%. ERT 426 Food Engineering
How to use food labels to plan a healthy diet? 4. Look for nutrient content claims & health claims: • Nutrient content claims described in a very consumer-friendly way how much of a nutrient (or its content) is in a food. • These include phrases: ‘sugar free’, ‘low sodium’, ‘good sources of fiber’……. • Some manufacturers include information about potential health benefits a person might get by consuming their products. • Manufacturers can make two (2) kinds of health claims: 1. Regular health claims 2. Qualified health claims. ERT 426 Food Engineering