Download
1 / 20
200 likes | 324 Vues
This document provides an in-depth overview of Georgia's education funding, highlighting significant challenges faced by Cobb County since 2002. It discusses a decline in state funding per student by 16.9% amidst growing student enrollment and an increase in economically disadvantaged students. The report further elaborates on austerity cuts impacting Cobb County, including substantial local revenue losses and their consequences on school resources, teaching positions, and class sizes. The analysis underscores the critical need for equitable funding to support educational quality.

E N D
Education Funding Overview Georgia Budget & Policy Institute Claire Suggs, Senior Education Policy Analyst November 11, 2013 Budget Overview | www.gbpi.org
Who We Are State policy think tank Nonprofit Non-partisan Founded in 2004 Budget Overview | www.gbpi.org
Our Policy Area Focus Taxes Budget Education Health Care Economic Security Economic Development Budget Overview | www.gbpi.org
Our work isn’t about the numbers… It’s telling the story of people using numbers
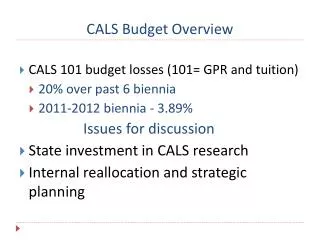
State Funding Since 2002 in Cobb County: State funding per student has declined 16.9 percent The number of students has grown 11 percent The percent of economically disadvantaged students has grown more than 21 percentage points
Shifting responsibility for K-12 funding: Georgia SOURCE: Georgia Department of Education and GBPI research
Shifting responsibility for K-12 funding: Cobb SOURCE: Georgia Department of Education and GBPI research
Austerity Cuts in Cobb County • QBE austerity cut is $65,900,761 for fiscal year 2014. • QBE austerity cut per student is $599. • Cumulative austerity cut is $491,296,767 since 2002.
Local Funding Between 2008 and 2012 in Cobb County: • Tax digest fell 17.8 percent between 2008 and 2012. • Local revenue per student fell by 12.3 percent.
Impact of Funding Losses • Cut the school calendar to 175 days • Increase class size • Eliminate 1,380 teaching positions since 2009 • Eliminate 113 instructional support positions since 2009 • Cut central office staff • Rely on reserve funds
Revenues Return to 2007 Levels General and Motor Fuel Funds 2007-2014 Fiscal Years
Drivers of Budget Growth $210 Million $109 Million $127 Million $42 Million $38 Million $35 Million 00 K-12 and University System Formula Growth 0 Medicaid and PeachCare Growth 0 Teacher and Employees Retirement 0 Systems Contributions Debt Services 0 K-12 Education Equalization 0 Department of Justice Settlement Agreement 0
FY 2014 State General & Motor Fuel Funds Budget ($18.8 billion) Most Georgia Spending is for Education 51.5% Education Other Georgia’s Fiscal Year 2014 Budget: $18.8 Billion
FY 2014 State General & Motor Fuel Funds Budget ($18.8 billion) Health Care is 2nd Largest Budget Expense Other Education 51.5% Education 51.5% Education 20.9% Health Care Georgia’s Fiscal Year 2014 Budget: $18.8 Billion
FY 2014 State General & Motor Fuel Funds Budget ($18.8 billion) Many Services in Smaller Category “Other” Other 27.6% Other Education 51.5% Education 51.5% Education Health Care Georgia’s Fiscal Year 2014 Budget: $18.8 Billion
FY 2014 State General & Motor Fuel Funds Budget ($18.8 billion) State Spending for “Other” Services 27.6% Public Safety 9.2% Debt Services 6.4% Transportation 4.3% General Gov 3.9% Human Services 2.6% Judicial Branch 0.9% Legislative Branch 0.4% Other Other 51.5% Education 51.5% Education Other 27.6%
State Savings Account Must Be Rebuilt State Savings Depleted During Recession 29 Days of reserves 2008 18 Days of reserves 2002 7.6 $103 M 2010 Days of reserves 2013 2
FY 2014 State General & Motor Fuel Funds Budget ($18.8 billion) Q & A Budget Overview | www.gbpi.org
Please sign up for our electronic email alerts on our website, like us on Facebook and follow us on Twitter. Claire Suggs, Senior Policy Analyst csuggs@gbpi.org www.gbpi.org Let’s Stay Connected www.facebook.com/gabudget @gabudget @clairevsuggs