Elevated Thunderstorms
Elevated Thunderstorms. James T. Moore Cooperative Institute for Precipitation Systems Saint Louis University Dept. of Earth & Atmospheric Sciences moore@eas.slu.edu COMET-RFC/HPC Hydrometeorology Course 6-13 December 2000. Definition of an “Elevated Thunderstorm” (Colman 1990, MWR).

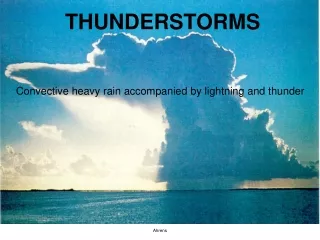
Elevated Thunderstorms
E N D
Presentation Transcript
Elevated Thunderstorms James T. Moore Cooperative Institute for Precipitation Systems Saint Louis University Dept. of Earth & Atmospheric Sciences moore@eas.slu.edu COMET-RFC/HPC Hydrometeorology Course 6-13 December 2000
Definition of an “Elevated Thunderstorm” (Colman 1990, MWR) • An elevated thunderstorm occurs above a frontal inversion • It is isolated from surface diabatic effects which are often considered fundamental to thunderstorm development • Colman’s criteria included: • observation must lie on the cold side of an analyzed front, showing a clear contrast in temperature, dew point, and wind • the station’s temperature, dew point, and wind must be qualitatively similar to immediately surrounding values • the surface air on the warm side of the analyzed front must have a higher e than the air on the cold side of the boundary
Elevated Thunderstorms (cont.)(Colman 1990, MWR) • These cold sector MCSs generally fit the Maddox frontal or meso-high type flash flood scenarios • Elevated thunderstorms can occur during any time of year; they usually as associated with heavy rain/snow or hail; nearly all winter-season thunderstorms over the United States east of the Rockies (excluding Florida) are of the elevated type. • Climatology of elevated thunderstorms reveals a bimodal variation; primary maximum in April, secondary maximum in September
Elevated Thunderstorms (cont.)(Colman, 1990, MWR) • Form in regions of moderate-strong, low-mid-tropospheric warm air advection and extremely stable PBL; typically a shallow front associated with a strong frontal inversion • Tend to form in the left exit region of the low-level jet • Form in hydrostatically stable environment with strong baroclinicity and vertical wind shear (veering) • Elevated thunderstorms tend to appear near the gradient in stability with a potential upstream source of buoyant air
Elevated Thunderstorms (cont.)(Colman, 1990, MWR) • Colman believed that elevated thunderstorms formed in convectively stable air associated with NO positive surface-based CAPE. • According to Colman – these storms appear to be the result of frontogenetical forcing in the presence of weak symmetric instability and not the result of upright convection. • However, more recent studies suggest that elevated max e CAPE >>0 can be found in the area of many of these elevated thunderstorms.
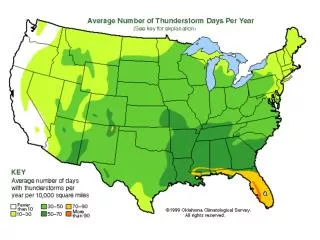
Elevated Thunderstorms Frequency Colman, 1990 (MWR)
Elevated Thunderstorms Climatology Colman, 1990 (MWR)
Elevated Thunderstorms Climatology Colman, 1990 (MWR)
Maximum Theta-e CAPE Using the Max theta-e CAPE makes sense when the lifting is at or above a frontal zone and the boundary layer air is very stable. Market, 1997
Elevated Convective Instability Trier and Parsons, 1993; MWR, vol. 121, 1078-1098
24 h Rainfall Ending 7 June 1993 Based Upon Cooperative Reports
Comparison of PBL CAPE and Max Theta-e CAPE for Elevated Convection
850 mb isotachs and wind vectors (l) and e for 12 UTC 6 June 1993 (r)
850 mb e advection for 12 UTC 6 June 1993
Plot of e vs. Pressure for Topeka, KS and Monett, MO for 12 UTC 6 June 1993
850 mb MTVs (l) and 500 mb heights/vorticity (r) - 12 UTC 6 June 1993
200 mb isotachs and wind vectors for 12 UTC 6 June 1993; solid line depicts cross section
Ageostrophic Direct Thermal Circulation along path of Cross section for 12 UTC 6 June 1993
24 h Rainfall Ending 28 April 1994 Based Upon Cooperative Reports
Isentropic Cross Section with Normal Wind Components for 00UTC 28 April 1994 from INL, MN to SIL, LA
Vertical Difference of e 500 mb to 850 mb at 00 UTC 28 April 1994: Note Negative (dashed) indicates convective instability
Cross Section of e INL, MN to SIL, LA – 00 UTC 28 April 1994
Mean parcel CAPE for 00 UTC 28 April 1994
Max e CAPE for 00 UTC 28 April 1994
Monett, MO sounding for 00 UTC 28 April 1994; Max e Cape = 1793 J kg-1, Surface-based CAPE = 0 J kg-1
Norman, OK sounding for 00 UTC 28 April 1994; Max e Cape = 2479 J kg-1, Surface-based CAPE = 0 J kg-1
Skew-T Plot of Monett, MO Sounding (left) and Vertical Motion on the 306 K Surface for 00 UTC 28 April 1994 (right)
Wind vectors and isobars on the 306 K surface (left) and moisture transport vectors on the 306 K surface (right) for 00 UTC 28 April 1994
Moisture Stability Flux on the 306 K surface at 00 UTC 28 April 1994. Note: Positive Values indicate regions of destabilization
Ageostrophic Direct Thermal Circulation 00 UTC 28 April 1994; taken from NW South Dakota to SW Arkansas
Regions Where Elevated Thunderstorms Form • North of shallow, but strong baroclinic zones; north of a quasi-stationary or warm front • Within zones of strong vertical wind shear; especially from surface – 500 mb, large veering with height of winds (typically from E-NE to S-SW) • Within the northern gradient of low-level e • Downstream from a maximum in moisture transport; in the region of moisture convergence • Often in the entrance region of an Upper-Level Jet (ULJ) streak
Regions Where Elevated Thunderstorms Form • Within a region of moderate 850 mb e advection • Within a region of relatively high max-e CAPE • Within a region of elevated convective instability • Within a region of high surface-500 mb mean relative humidity • Typically within an area of moisture stability flux > 0 implying dynamic destabilization and moistening of the lower layers • Within a region characterized by moderate isentropic upslope