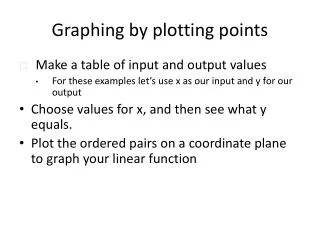
Graphing by plotting points
Graphing by plotting points. Make a table of input and output values For these examples let’s use x as our input and y for our output Choose values for x, and then see what y equals. Plot the ordered pairs on a coordinate plane to graph your linear function. y = x.

Graphing by plotting points
E N D
Presentation Transcript
Graphing by plotting points • Make a table of input and output values • For these examples let’s use x as our input and y for our output • Choose values for x, and then see what y equals. • Plot the ordered pairs on a coordinate plane to graph your linear function
y = x • Make a table of input and output values • Plot your points. x = y
y = 2x • Make a table of input and output values • Plot your points. x 2x y
y = 1/2x • Make a table of input and output values • Plot your points. x .5x y
y = -3x + 2 • Make a table of input and output values • Plot your points. x -3x + 2 y