Download
1 / 33
350 likes | 494 Vues
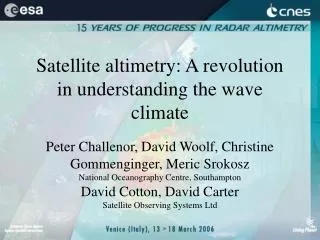
Satellite altimetry: A revolution in understanding the wave climate. Peter Challenor, David Woolf, Christine Gommenginger, Meric Srokosz National Oceanography Centre, Southampton David Cotton, David Carter Satellite Observing Systems Ltd. Summary. The early years Calibration Wave climate

E N D
Satellite altimetry: A revolution in understanding the wave climate Peter Challenor, David Woolf, Christine Gommenginger, Meric SrokoszNational Oceanography Centre, SouthamptonDavid Cotton, David CarterSatellite Observing Systems Ltd
Summary • The early years • Calibration • Wave climate • Extremes • Beyond significant wave height • The future
30 years of altimeter waves • Starts with GEOS-3 • Then Seasat • For the first time we could see the world
Calibration • Altimeter wave heights are very accurate. • They are at least as good as wave buoys But the measurements differ from altimeter to altimeter. Use buoy networks to ensure consistency
The wave climate • The biggest signal in the wave climate is of course seasonal.
A statistical model for wave height • Build a model to predict wave climate from the NAO Index • For each 2° square regress monthly mean Hs on the NAO • (An alternative would be to regress on the EOF’s)
Extremes • Many people are not interested in mean wave conditions but in the extremes • Usually these are expressed in terms of 50 or 100 year return values
Peaks over Thresholds (POT) The upper tails of statistical distributions tend to a limiting distribution - the Generalised Pareto Distribution (GPD) • Set a high threshold • Fit a GPD to the exceedences about that threshold Undersampling will lead to an underestimate of the extremes by about 10-15% (Robinson and Tawn)
If we add seasonal dependence and an NAO.seasonal interaction term we get a better fit These plots show a low (left) and high (right) NAO January H50 relative to average condtions
Beyond Significant Wave Height • S and C band • Wave Period • Skewness • Individual echoes • Phase
S Band / Ku Band Hs vs Buoy Data Variance of the S-band SWH is about 25 times that of the Ku-band. Factor of 20 times is accounted for by the reduced number of pulses averaged to get the S-band 1-Hz values.
S-band Hs much ‘noisier’, s0 shows better continuity+++ means rain flag is raised
Hurricane Katrina o Ku-band x S-Band
Wave Period and the NAO • In a similar way to wave height wave period relates to the NAO The above shows the first EOF of period. On the left we have a regression of Tm on the NAO
Location of ENVISAT RA2 Individual echo bursts Courtesy of J.Garlick, DeMontfortUniversity
Is it possible to estimate the wave spectrum from phase information?
Wave models • Wave models give an alternative source of information on the wave climate • Assimilation • Validation • Complementary
Conclusions • Radar altimeters are now the main way to gain information on the wave climate • Careful calibration is however still needed • Wave climate varies both seasonally and from year to year. • It is possible to obtain extremes from altimeter data • There are exciting prospects for the future