Download
1 / 30
630 likes | 2.03k Vues
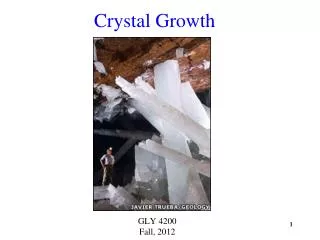
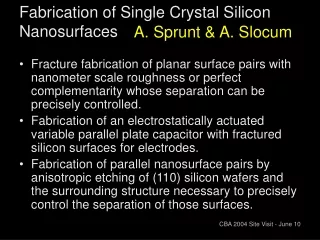
Chapter 3 Crystal growth, wafer fabrication and basic properties of silicon wafers. Silicon crystal structure and defects. Czochralski single crystal growth. Growth rate and dopant incorporation for CZ method. Float zone single crystal growth and doping. Wafer fabrication.

E N D
Chapter 3 Crystal growth, wafer fabrication and basic properties of silicon wafers Silicon crystal structure and defects. Czochralski single crystal growth. Growth rate and dopant incorporation for CZ method. Float zone single crystal growth and doping. Wafer fabrication. Measurement methods. NE 343: Microfabrication and thin film technology Instructor: Bo Cui, ECE, University of Waterloo; http://ece.uwaterloo.ca/~bcui/ Textbook: Silicon VLSI Technology by Plummer, Deal and Griffin
Czochralski process - crystal growth rate We wish to find a relationship between pull rate and crystal diameter. Heat balance: heat conducted through the crystal (B) heat radiated away (C). latent heat of fusion (i.e. crystalization) + heat conducted from melt to crystal (A) = = Freezing occurs between isotherms X1 and X2. (1) (A) (B) A1,2 = Cross-sectional area
Czochralski process - crystal growth rate (2) The rate of growth of the crystal is where vP is the pull rate and N is the density. Neglecting the middle term in Eqn. (1) we have: (3) In order to replace dT/dx2, we need to consider the heat transfer processes. Heat radiation from the crystal (C) is given by the Stefan-Boltzmann law*: Heat conduction up the crystal is given by (4) (5) 2πrdx = radiation surface. σ=Boltzman constant (NOT kB) kS = thermal conductivity of the solid. =1 for perfect blackbody. <1 for “grey-body”. *Stephen-Boltzmann law: http://en.wikipedia.org/wiki/Stefan%E2%80%93Boltzmann_law
Czochralski process - crystal growth rate • Differentiating (5), we have (6) (7) • Substituting (6) into (4), we have • kS varies roughly as 1/T, so if kM is the thermal conductivity at the melting point, (8) (9) • Solving this differential equation, evaluating it at x = 0 and substituting the result into (3), we obtain (see text): (10) Vpmax = maximum pull rate, inversely proportional to the square root of crystal radius.
Crystal growth rate: example For perfect blackbody: =1 For “grey” body: <1 4 hours to pull one meter long boule. However, this equation is not so accurate, and in practice feedback is used to adjust the pulling rate in order to maintain constant diameter.
Dopant incorporation during crystal growth • Dopants are added to the melt to provide a controlled N or P doping level in the wafers. • However, the dopant incorporation process is complicated by dopant segregation. • Generally, impurities “prefer to stay in the liquid” as opposed to being incorporated into the solid. • This process is known as segregation. The degree of segregation is characterized by the segregation coefficient, ko, for the impurity. CS CS and CL are the impurity concentration just on the either side of the solid/liquid interface. CL
Dopant behavior during crystal growth Most k0 values are <1 which means the impurity prefers to stay in the liquid. Thus as the crystal is pulled, dopant concentration will increase. In other words, the distribution of dopant along the ingot will be graded.
Distribution coefficient: example =1.019×10⁻⁴mol
Dopant incorporation during crystal growth VO = initial volume IO = number of impurities CL = impurity concentration in the melt C0 = initial impurity concentration in the melt C0 = I0/V0 By definition: CS/CL=k0 If during growth, an additional volume dV freezes, the impurities incorporated into dV are given by: The impurity level in the crystal (Cs) f = Vs/Vo, the ratio of solid silicon to the initial liquid volume.
Doping concentration versus position along the grown CZ crystal for common dopants in silicon Note the relatively flat profile produced by boron with a koclose to 1. Dopants with ko<< 1 produce much more doping variation along the crystal. Doping concentration in a solid as a function of the fraction solidified. (but no dopant has ko>1)
Chapter 3 Crystal growth, wafer fabrication and basic properties of silicon wafers Silicon crystal structure and defects. Czochralski single crystal growth. Growth rate and dopant incorporation for CZ method. Float zone single crystal growth and doping. Wafer fabrication. Measurement methods.
Float-zone crystal growth: overview • For CZ-grown Si, impurities (O and C) can be introduced from the melt contacting the SiO2 crucible and from graphite susceptor/supporter. • This limits the resistivity to 20Ωcm, while intrinsic Si is 230kΩcm. • These crystals are more expensive and have very low oxygen and carbon and thus, are not suitable for the majority of silicon IC technology. • Carrier concentrations down to 1011 atoms/cm3 have been achieved. • It is far less common, and is reserved for situations where oxygen and carbon impurities cannot be tolerated. • Float-zone does not allow as large Si wafers as CZ does (200mm and 300mm) and radial distribution of dopant in FZ wafer is not as uniform as in CZ wafer. • It is good for solar cells, power electronic devices (thyristors and rectifiers) that use the entire volume of the wafer not just a thin surface layer, etc.
Float-zone crystal growth process • Polycrystalline silicon is converted into single-crystal by zone heating (zone melting). • The entire poly-Si rod from the EGS process is extracted as a whole. • The rod is clamped at each end, with one end in contact with a single crystal seed. • An RF heating coil induces eddy currents (power I2R) in the silicon, heating it beyond its melting point in the vicinity of the coil. • The "floating" melt zone is about 2cm wide/high. • The seed crystal touches the melt zone and is pulled away, along with a solidifying Si boule following the seed. The crystalline direction follows that of the seed single crystal. • Limited to about a 4" wafer, as the melt zone will collapse - it is only held together by surface tension (and RF field levitation). Poly-Si Melt is not held in a container, it is “float”, thus the name “float zone”. c-Si RF coil
Float-zone: zone refining • Dopants/impurities prefer to stay in the liquid than in the solid. • Thus, the impurities generally stay in the melt zone, and don't solidify in the boule. • That is, segregation (and evaporation) of impurities in the melt zone help purify the Si further. • One can "purify" FZ wafers further by successively passing the coil along the boule. The impurities then segregate towards the end of the boule. • Of course, if neglecting impurity evaporation, the total amount of impurity is the same. Yet the impurity at the lower part is much lower than, and at the upper part approaches to, the original impurity concentration. • Thermal instability in the melt zone can cause micro-variations in composition and doping. Difficult in making a uniform dopant concentration.
Doping in FZ growth (Doping can of course be achieved if the starting material poly-crystalline Si rod is doped. But due to zone-refining, the doping is not uniform along the boule) Gas doping: Dopants are introduced in gaseous form during FZ growth. n-doping: PH3 (Phosphine), AsCl3 p-doping: B2H6 (Diborane), BCl3 Good uniformity along the length of the boule. Pill doping: Drill a small hole in the top of the EGS rod, and insert the dopant. If the dopant has a small segregation coefficient, most of it will be carried with the melt as it passes the length of the boule. Resulting in only a small non-uniformity. Ga and In doping work well this way.
Zone refining Zone length is L. The rod has initial uniform impurity concentration of C0. If the molten zone moves upwards by dx, the number of impurities in the liquid (=I) will change since some will be dissolved into the melting liquid at the top (=C0dx) and some will be lost to the freezing solid on the bottom (=CSdx=k0CLdx). Thus: (assume cross-sectional area =1)
Floating zone crystal growth – zone refining Zone refining with multiple passes, k0=0.1. L is the length of the molten zone. Impurity during float-zone growth or zone refining. One pass of the molten zone through the solid. L is the length of the molten zone (2cm)
Chapter 3 Crystal growth, wafer fabrication and basic properties of silicon wafers Silicon crystal structure and defects. Czochralski single crystal growth. Growth rate and dopant incorporation for CZ method. Float zone single crystal growth and doping. Wafer fabrication. Measurement methods.
Wafer slicing Traditional method of slicing Wire saw for large wafers The saw blade itself is about 400m thick, together with the loss at the seed and tail end of the crystal, only 50% of the boule ends up in wafer form. After slicing, mechanical lapping and wet chemical etching is performed before final chemical mechanical polishing. The wet etching is typically: 3Si + 4HNO3 + 18HF 3H2SiF6 + 4NO + 8H2O
Wafer polishing Chemical mechanical polishing Slurry consists of nano-particles (10nm SiO2 or Al2O3) and chemicals (NaOH). The rotation and pressure generates heat that drives a chemical reaction in which OH- radicals from the NaOH oxidize the silicon. The SiO2 particles abrade the oxide away.
Common (not always) wafer surface orientation Should be {110} plane Another flat configuration for {100} n-type wafer {100} wafer usually breaks along {110} plane (actually Si cleaves naturally along {111} plane, which meet the surface at an angle of 54.7o, the angle between <001> and <111>). Sometimes (not often) {100} wafers break along {100} plane. ({100} = (100)+(010)+(001))
Advantage of larger diameter wafers More chips per wafer for larger wafer.
Chapter 3 Crystal growth, wafer fabrication and basic properties of silicon wafers Silicon crystal structure and defects. Czochralski single crystal growth. Growth rate and dopant incorporation for CZ method. Float zone single crystal growth and doping. Wafer fabrication. Measurement methods.
Vm Hot probe measurement of carrier type Cold Hot e- n-type wafer • The hot probe technique is used to determine the type of dopant in a wafer. • It relies on the generation of the Seebeckvoltage (open circuit), i.e. the diffusion of free carriers (electrons or holes) as a result of a temperature gradient. • The sign of the voltage tells the carrier type. • Alternatively, one can measure the current direction (short circuit). • The current that flows due to the majority carrier is given by • Pn is thermoelectric power, negative for electrons, positive for holes.
I V t S d Electrical measurement techniques – four point probe =(en)-1, is mobility, n is carrier density. The four point probe method measures the resistance/resistivity of a wafer. Using values of carrier mobility, one can calculates the carrier concentration. Use four points (rather than two) to eliminate the effect of contact resistance.
Hall measurement of carrier type & mobility Thickness of the slab is t (along B direction), width is w (along VH direction). VH is measured, and used to calculate RH. Then carrier concentration p, n=1/qRH. Hall voltage (VH) measurement Silicon is placed inside a magnetic field and the resultant motion of charge will experience a force perpendicular to the electric field. F=qvB In equilibrium this results in a transverse potential difference known as the Hall voltage VH. (such that F=qE=qVH/w=qvB, i.e. forces are balanced, so VH=vBw) The magnitude and sign of the Hall voltage leads directly to the carrier concentration, type, and mobility (if the resistivity is known). Current density j=I/tw=E/=qnv, VH=vBw=(I/twqn)Bw=IB/tqn. Hall coefficient RHVHt/BI=1/qn=μH, μH is Hall mobility (we know that =1/qn). (μH is slightly lower than conductivity mobility, due to more scattering when magnetic field is present. can be measured from four-point probe)
Crystal CZ growth: GaAs • GaAs Liquid Encapsulated CZ (LEC): • GaAs single crystal is more difficult to grow than Si. • At 1238oC, the vapor pressure of As is 10 atmospheres, while Ga is only 0.001 atmospheres. • So As is rapidly lost to evaporation, resulting in Ga-rich melt (non-stoichiometric). • A cap is used to encapsulate the melt and stop evaporation. • This cap is typically B2O3 that melts at 400oC. • This allows the seed crystal to be lowered through the liquid cap and pulled out of the cap.
Horizontal Bridgman GaAs growth Historically, high defect density with LEC GaAs limits its use from electronic applications. Most GaAs for optoelectronics is produced by Bridgman method. The GaAs charge is held in a sealed ampoule with excess arsenic. Thus, higher As pressure can be reached that limits As evaporation.