Download
1 / 8
80 likes | 189 Vues
This research investigates the differential impact of AdvIκBα on cytokine production and NF-κB activation. Multiple figures illustrate the effects on uninfected cells at varying treatment ratios and the resultant changes in cytokines such as TNFα, IL-1β, and IL-10. The data also include analyses of MAP kinases and their relationship with NF-κB signaling. Furthermore, the production rates of MMPs and other relevant cytokines are presented, providing insights into the inflammatory responses under different conditions.

E N D
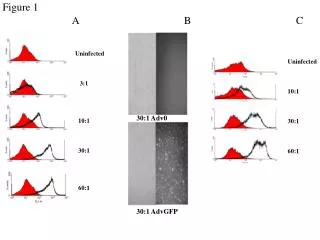
Figure 1 A B C Uninfected 3:1 10:1 30:1 60:1 Uninfected 10:1 30:1 60:1 30:1 Adv0 30:1 AdvGFP
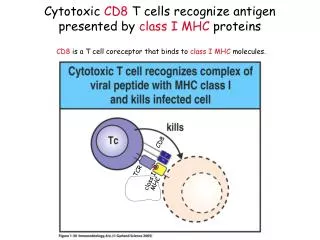
Figure 2 Cytosolic IB p42/44 MAP kinases NFB activation on EMSA Uninf AdvIB Adv0
Figure 3 Adv0 180 160 AdvIB 140 120 100 % production 80 60 40 20 0 TNF IL-1 IL-10 Cytokine
Figure 4 Adv0 140 AdvIB 120 100 80 % production 60 40 20 0 IL-6 IL-8 MCP-1 OnST-M GM-CSF Cytokine
IL-11 IL-1 RA p55sTNF-R p75sTNF-R Figure 5 Adv0 120 AdvIB 100 80 % production 60 40 20 0 Cytokine
Figure 6 160 Adv0 140 AdvIB 120 100 % production 80 60 40 20 0 MMP-1 MMP-3 MMP-9 MMP-13 TIMP-1
Figure 7 TNF + Cycloheximide AdvIkBa Treatment AdvO 0 0.0 0.5 1.0 1.5 2.0 2.5 3.0 3.5 Caspase Ratio E A B C D
Figure 8 A B Uninfected Uninfected Adv0 Adv0 AdvIB AdvIB