Chapter7: Quality Tools
Chapter7: Quality Tools. QC TOOLS. Tools for Problem Solving & ANALYSIS.


Chapter7: Quality Tools
E N D
Presentation Transcript
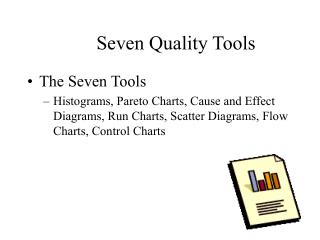
QC TOOLS Tools for Problem Solving & ANALYSIS • The problems you face can be large or small, simple or complex, and easy or difficult to solve. Regardless of the nature of the problems, a fundamental part of every employee’s role is finding ways to solve them. Having tools to solve problems and being a confident problem solver is important to your success. Problem solving tools are determined by the requirements of the problem and the amount of time to solve the problem. There are four basic steps in problem solving regardless of size or complexity: • 1. Defining the problem • 2. Generating alternatives • 3. Evaluating and selecting alternatives • 4. Implementing solutions The QC Tools are simple statistical tools used for problem solving. These tools were either developed in Japan or introduced to Japan by the Quality Gurus such as Deming and Juran. In terms of importance, these are the most useful. Kaoru Ishikawa has stated that these 7 tools can be used to solve 95 percent of all problems. Objectives of this training • To explain various tools that support deep analysis of problem solving. • Explain how the QC tools Support in decision making after analysis, • Update on the best proven tools in quality. Proven Tools for industrial problem solving and Analysis • The 7 QC Tools are simple statistical tools used for problem solving. These tools were either developed in Japan or introduced to Japan by the Quality Gurus such as Deming and Juran. In terms of importance, these are the most useful. Kaoru Ishikawa has stated that these 7 tools can be used to solve 95 per cent of all problems. These tools have been the foundation of Japan's astonishing industrial resurgence after the second world war. • The following are the 7 QC Tools : • Pareto Diagram • Cause & Effect Diagram • Histogram • Control Charts • Scatter Diagrams • Graphs • Check Sheets
MAN GAUGE Component Locking Insufficient power Method of Alignment Method of Inspection MATERIAL METHOD The Fishbone Diagram also referred to as the "Ishikawa diagram," because Kaoru Ishikawa developed it, and the "fishbone diagram," because the complete diagram resembles a fish skeleton. The diagram illustrates the main causes and sub causes leading to an effect (symptom). It is a team brainstorming tool used to identify potential root causes to problems. Because of its function it may be referred to as a cause-and-effect diagram. In a typical Fishbone diagram, the effect is usually a problem needs to be resolved, and is placed at the "fish head". The causes of the effect are then laid out along the "bones", and classified into different types along the branches. Further causes can be laid out alongside further side branches. So the general structure of a fishbone diagram is presented below. QC Tools Fishbone Diagram Why Why Why The symptom or result or effect for which one wants to find causes is put in the box on the right. The lighter boxes at the end of the large bones are main groupsin which the ideas are classified. The causes and its factors are identified and entered as branches to these main groups. The Sub reasons or Sub factors are linked to the factors. Man Materials External Training Availability Expertise Quality Delivery Purchase Unable to complete Project on time Multi Use Utilization Approval Maintenance Performance Availability Availability Methods Funds Machines
QC Tools Pareto Analysis Pareto Analysis is a statistical technique in decision making that is used for the selection of a limited number of tasks that produce significant overall effect. It uses the Pareto Principle (also know as the 80/20 rule) the idea that by doing 20% of the work you can generate 80% of the benefit of doing the whole job. In quality improvement, a large majority of problems (80%) are produced by a few key causes (20%). This is also known as the vital few and the trivial many. Pareto Diagram is a tool that arranges items in the order of the magnitude of their contribution, thereby identifying a few items exerting maximum influence. This tool is used in SPC and quality improvement for prioritising projects for improvement, prioritising setting up of corrective action teams to solve problems, identifying products on which most complaints are received, identifying the nature of complaints occurring most often, identifying most frequent causes for rejections or for other similar purposes. The value of the Pareto Principle for a Black belt manager is that it reminds you to focus on the 20% of things that matter. Of the things you do during your project, only 20% are really important. Dr.Juransuggested the use of this principle to quality control for separating the "vital few" problems from the "trivial many" now called the "useful many".
QC Tools Histogram What is the shape of your data? Knowing the shape of your data is as significant as the measures like Mean, Median etc. The shape of the data set helps in identifying any obvious errors and outliers that may be removed and the measures recomputed. The shape also helps in determining the spread in the data. An important aspect of the description of a variable is the shape of its distribution, which tells you the frequency of values from different ranges of the variable. A data analyst is interested in knowing how well the distribution can be approximated by the normal distribution. A simple study of the shape gives a fair idea about the datas approximation to normality. Target 3.75 mm Histograms or Frequency Distribution Diagrams are bar charts showing the distribution pattern of observations grouped in convenient class intervals and arranged in order of magnitude. Histograms are useful in studying patterns of distribution and in drawing conclusions about the process based on the pattern. The Histogram is normal if the highest frequency is in the central group and there is symmetrical tapering on either side of the central group. The natural or normal distribution would indicate that the process being studied is under control. A Histogram with an unnatural pattern may indicate that there is possibly something unusual with the process, but is not an evidence of a process being out of control. For instance a Histogram depicting the distribution of age of all citizens will not peak at the centre. It will start with a cliff tapering gradually till around the life expectancy then dropping a little faster and once again tapering into along tail. 0.03 mm Target • Upon studying a histogram the following can be immediately inferred. • Where is the process output concentrated? • What is the spread in the process? • Is the process performing within specification limits? • What are the outliers in the process and how to set controllable limits? • If action needs to be taken on the process, what action is appropriate? • Is the assumption on the distribution of the variable correct? USL:3.78 LSL:3.72 0.03 mm USL:3.78 LSL:3.72
QC Tools Correlation Stage 5 Defects 100 When solving a problem or analyzing a situation one needs to know the relationship between two variables. A relationship may or may not exist between two variables. If a relationship exists, it may be positive or negative, it may be strong or weak and may be simple or complex. A tool to study the relationship between two variables is known as Scatter Diagram. A relation expressed in correlation coefficient is between -1 and +1. The extremes mean high correlation or relation ship 75 R2=0.84 50 10 Stage 3 Defects 20 30 40 When solving a problem or analysing a situation one needs to know the relationship between two variables. A relationship may or may not exist between two variables. If a relationship exists, it may be positive or negative, it may be strong or weak and may be simple or complex. A tool to study the relationship between two variables is known as Scatter Diagram. It consists of plotting a series of points representing several observations on a graph in which one variable is on X-axis and the other variable in on Y-axis. If more than one set of values are identical, requiring more points at the same spot, a small circle is drawn around the original dot to indicate second point with the same values. The way the points lie scattered in the quadrant gives a good indication of the relationship between the two variables.
QC Tools Component replacement Component replacement method: Use this method to find the sub system that contributes to the problem and also to identify the source of this problem. Replace subcomponents from good with bad and find the subsystem that contributes to the problem. • Component search is part of statistical engineering, as developed by Shainin, is a contrast based approach to problem solving. Statistical engineers ask what's different rather than what's wrong. They look for the largest source of variation, not all possible causes. They avoid identifying lists of potential variables until the convergent process has substantially narrowed the possibilities. • Dorian Shainin … has given us DOE tools that can diagnose and greatly reduce variation, leading us beyond zero defects, beyond the milestone of Cpk of 2.0, to near zero • variability. These tools are: • • Simple– understood by engineers and line workers alike. The mathematics involved are unbelievably – elementary! • • Logical – based on common sense. • •Practical – easy to implement – in production, in design, with suppliers. • • Universal in scope – applicable in a wide range of industries, big and small, process-intensive as well as assembly-intensive. • • Statistically powerful – in terms of accuracy, with no violations of statistical principles. • • Excellent in terms of results – with quality gains not in the inconsequential range of 10-50% improvement but in the 100-500% range!” Consider component search on an electrical part with several subcomponents, by swapping the good subcomponents with bad parts and also by replacing bad ones with good subcomponents the results should vary based on the output. This should also be repeated on many samples. The Shainin methods look for the "Big Red X" as the main root cause of product deficiencies. They help to identify the failed part in a few iterative steps, so that the failure can be fixed quickly with minimum cost.
QC Tools 5 Whys Why? Why? Why? When something goes wrong, we tend to see it as a crisis and seek to blame. A better way is to see it as a learning opportunity. Not in the existential sense of general self-improvement. Instead, we can use the technique of asking why five times to get to the root cause of the problem. The 5-Why is a useful exercise to track a single line of cause and effect but it seems to lead to a causal factor rather than a root cause. Why? The choice faced by people trying to solve problems is: HOW MUCH EFFORT IS NEEDED TO FIND A REAL, EFFECTIVE SOLUTION TO A PROBLEM? IS IT WORTH MY TIME? My point is that 5-Whys are EASY and easy-to-understand but often don’t get us to an effective solutions. Thus no matter how easy the technique is, most people are wasting their time but they THINK they are doing effective analysis. What they are really doing is trying solutions and seeing what works. But I think that it could be applied to 5-Whys. People have activity (they are asking questions) but that doesn’t mean that the questions are helping them understand the problem and develop effective solutions. Instead, they are guiding the questions to get to answers THEY ALREADY KNOW. They then apply these answers which may work or which may appear to work (because the incident doesn’t repeat in the near-term Corrective actions: bring the site back up remove the bad code help so-and-so understand why his code doesn't work as written train so-and-so in the principles of TDD change the new engineer orientation to include TDD.
Process mapping is a tool that is used to understand, analyse and document processes and activities in an organisation and assist in identifying opportunities for improvement.A proper process map is like a strong foundation for six sigma project and to be successful. A process map displays the sequential steps involved in converting a specific input into the required output, QC Tools Process Mapping A Map is a visual representation for the team leader’s or an entire team’s thoughts, ideas and questions relative to accomplishing the project goal. It should be one of the first tools employed when starting any Six Sigma or process improvement project. The Map presents a structure of information and helps a team progress through the DMAIC process. It is a living document that will change throughout the project and has no set format. The process map can be used to drive specific actions and select the Six Sigma tools that should be employed. early in a project is it ensures that nothing is left out or missed. It is an effective tool for ensuring all potential questions and issues of a project have been both identified and addressed from the beginning of a project to completion. The following are the steps in development of a process map. Cutting to Size Marking out Start Ship Testing Review Ship Stop Step 1: Define the Project Goal(s) First and foremost, a team needs to clearly define the goal. What is the team trying to accomplish? Is it a problem that needs to be solved? Is it a potential opportunity for growth that needs to be explored? By defining the goal, the team also will define the project scope. This is essential to do early on in a project. the scope, includes a problem statement, objective, benefits, team members, process owner and Champion) is very helpful in this step, as it should contain the goal or problem statement of the project. Eg: “The receipt and processing of delivered materials takes too much time.” Step 2: List the Knowns and Unknowns For this step, it is most helpful to simply create two columns – one for what the team knows and one for what the team does not know. It might be surprising how much information is known, but even more surprising how much the team does not know. Information can include, but is not limited to metrics, times, costs, issues, potential barriers, points-of-contact, current problems, customer requirements, outputs, inputs, process steps, quantities and locations. Knowing pertinent information and data in the initial stages is important; however, equally important is realizing what data the team will need to research.
QC Tools Process Mapping Step 3: Ask DMAIC Questions and ‘Grouped’ Questions This step coincides closely with the previous step. Team members will recognize that their unknowns (from Step 2) and questions from this step are very similar. The main difference is the approach. Using two separate approaches allows very different pieces of information and questions to surface. In the previous step, the team is stating inquiries from the perspective that they simply do not know a vital piece of information. In this step, they are asking questions from both the DMAIC approach, as well as a grouped approach. First, ask questions from the categorical perspectives of DMAIC: Define, Measure, Analyse, Improve and Control. These will be the five areas into which all questions will be categorized. It is important to ask as many questions as possible – this is really a brainstorming exercise and no question is a bad question. • A MAP should include, but is not limited to: • The project goal(s) or problem statement(s) • Specific areas/parts of a process to be analysed • Any issues or questions to address • What is known about those issues or questions • What is not known about those issues or questions • Initial assumptions about each issue or question. • What data or information is needed • Potential barriers reaching the project goal • Interconnections between each part/issue/question • Potential Six Sigma tools to be used • When creating a MAP, the only wrong piece of information is the one left out. Next, the team needs to ask questions from the perspective of groups that are within or affect the process
QC Tools Process Mapping Step 4: Sequence and Link the Questions Now it all comes together. Sequence questions below the problem statement (or goal) and flow them down. Additionally, link questions that are related to each other. The team members will find in this step that they will generate many additional questions.
STEP 5: Identify Possible Tools to Be Used Finally, the project team should identify the potential Six Sigma tools to be used to answer the questions posed. The most effective way to perform this step is to create a four-column matrix, as illustrated in the table below. It should have a column for the question, the tool or method, who is responsible, and the due date. And with this table, the TMAP process is complete, and the Six Sigma project is off to a strong start. QC Tools Process Mapping Another common format for a MAP is using a Mind Map or a relationship flow as illustrated in the following process flow. This format often works better for processes that have many links. The five-step process can still be used to create it. Format is not significant as long as the MAP helps the team in achieving its objective of a successful Six Sigma project. This approach gives a high level view of projects and processes in hand, also supports in decision making for management.