Quality Tools
Quality Tools. Plan. Act. Do. Study. The PDSA Cycle. Select a process. Document. Study/document. Evaluate. Seek ways to Improve it. Implement the Improved process. Design an Improved process. The Process Improvement Cycle. Process Improvement Tools.


Quality Tools
E N D
Presentation Transcript
Plan Act Do Study The PDSA Cycle
Select a process Document Study/document Evaluate Seek ways to Improve it Implement the Improved process Design an Improved process The Process Improvement Cycle
Process Improvement Tools • There are a number of tools that can be used for problem solving and process improvement • Tools aid in data collection and interpretation, and provide the basis for decision making
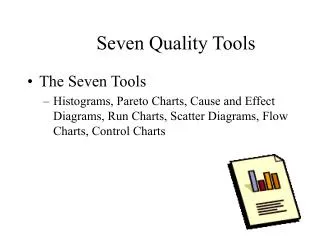
Seven Basic Quality Tools • Check sheets • Flowcharts • Scatter diagrams • Histograms • Pareto analysis • Control charts • Cause-and-effect diagrams
Check Sheet Monday • Billing Errors • Wrong Account • Wrong Amount • A/R Errors • Wrong Account • Wrong Amount
Flowchart Process Process Process Good? Good? Process
Scatter Diagram Variable B Variable A
Histogram frequency A B C D E
Number of defects Offcenter Smeared print Missing label Other Loose Pareto Analysis 80% of the problems may be attributed to 20% of the causes.
1020 UCL 1010 1000 990 LCL 980 970 0 1 2 3 4 5 6 7 8 9 10 11 12 13 14 15 Control Chart
Methods Materials Cause Cause Cause Cause Effect Cause Cause Environment Cause Cause Cause Cause Cause Cause People Equipment Cause-and-Effect Diagram
UCL UCL UCL LCL LCL Additional improvements made to the process LCL Process centered and stable Process not centered and not stable Tracking Improvements
Seven Management Tools • Affinity Diagram • Interrelationship Diagraph • Tree Diagrams • Prioritization Matrices • Matrix Diagram • Process Decision Program Chart • Activity Network Diagram
Methods for Generating Ideas • Brainstorming • Quality circles • Interviewing • Benchmarking • 5W2H
Rediscovering the Gurus • Deming • Emphasis on Statistical Control • 14 Points for Management • Juran • Quality Planning and Analysis • Managerial Breakthrough • Quality Control Handbook
What Types of Companies Can Benefit from Six Sigma? • Companies that benefit from structured organizational improvement • Companies that need to improve customer satisfaction • All types of companies can benefit: • Manufacturing • Service • Non-profit • Educational
What is Six Sigma? • Customer Focus – Focus on what is critical to customers • Data Driven – Extensive use of statistical tools • Robust Methodology – Tools plus implementation methods to make success more likely
What is Six Sigma?Key Concepts • Critical to Quality: What attributes are most important to the customer? (CTQ, CTC, CTD) • Defect: Failing to deliver what the customer wants / expects (DPMO) • Variation: The level of unpredictability the customer experiences
What is Six Sigma?Key Concepts • Process Capability: What your process can deliver – consistently • Stable Operations:Stable ops are predictable • Design for Six Sigma:Designing to meet customer needs and process capability
DMADV - DMAIC Existing Processes New Processes
Statistics LiteCentered 3sProcess LSL USL s
Statistics LiteCentered 3sProcess Non-conforming Product 1,300 DPMO LSL USL s
Statistics LiteCentered 3sProcess Non-conforming Product 2,600 DPMO LSL USL s
Statistics LiteShifted 3sProcess LSL USL s 1.5 s mean shift
Statistics LiteShifted 3sProcess Non-conforming Product 66,800 DPMO LSL USL s 1.5 s mean shift
Statistics LiteShifted 3sProcess Cost to your company – 15-30% of sales Non-conforming Product 66,800 DPMO LSL USL s 1.5 s mean shift
Cost of Poor Quality 5-8% of Sales Inspection Overtime Downtime Rejects Rework 15-22% of Sales Lost sales Long cycle times Cost of Capital Late delivery (less obvious) Redundant Operations Lost Opportunity Inaccurate Reports Expediting costs Excessive Planning Lost Customer Loyalty
LSL USL s Statistics LiteCentered 6sProcess
Statistics LiteShifted 6sProcess LSL USL s 1.5 s mean shift
Statistics LiteShifted 6sProcess Non-conforming Product 3.4 DPMO LSL USL s 1.5 s mean shift
Why Six Sigma? 99% (3.8 Sigma) 99.99966% (6 Sigma) • Seven articles lost per hour • 2 incorrect operations per week • One short or long landing every five years • 70 wrong prescriptions per year • One hour without electricity every 34 years • 20,000 lost articles of mail per hour • 5,000 incorrect surgical operations per week • Two short or long landings at most major airports each day • 200,000 wrong drug prescriptions each year • No electricity for almost seven hours each month
Six Sigma Breakthrough Strategy • Define • Measure • Analyze • Improve • Control
DMADV - DMAIC New Processes Existing Processes
Define - Selecting Projects • The project must relate to customer satisfaction • The project’s results must reduce defects by some threshold amount • The project should achieve some threshold of cost savings.