Domain 5 - Quality tools
390 likes | 661 Vues
Domain 5 - Quality tools. R Shivram. Flow. Definition & Types of tools Tools for ideas and information Questions. Definition. A vehicle that assist in performing a task. They can be used in Defining a mission, vision, goals, and objectives Defining Do and Check processes

Domain 5 - Quality tools
E N D
Presentation Transcript
Domain 5 - Quality tools R Shivram
Flow • Definition & Types of tools • Tools for ideas and information • Questions
Definition • A vehicle that assist in performing a task. They can be used in • Defining a mission, vision, goals, and objectives • Defining Do and Check processes • Defining measures • Collecting data • Problem-solving • Designing solutions • Improving processes • Measuring results • Tools are grouped under the 3 following categories • Tools for ideas and information • Tools for numbers • Tools for presentation
C-E diagram • Force field analysis • Flow chart • Matrix • QFD Tools for ideas and information Brainstorming Affinity Diagram Nominal group Technique Benchmarking Play script
Brainstorming What is Brainstorming? Brainstorming is an idea generation technique useful whenever a wide variety of ideas is desirable. Why Brainstorming is useful? Many ideas are produced in a short amount of time. (Repeated Question) Increases the involvement and participation of team members Problem solving process more fun and interesting. Build on each other’s creativity while staying focused on their joint mission. Types of Brainstorming Structured Unstructured Application Defect prevention at Infosys - to generate ideas for preventing defects
Affinity Diagram • Extension of Brainstorming • Tool to help create order out of chaos • Procedure • Write each idea • Arrange randomly • In silence team members move the cards into meaningful groups • The team discusses and then labels each category • The team uses C-E if needed, to discuss on each category • Application • Can be used to group the list of causes under categories like people, process, technology, management etc.,
Nominal group technique • It is structured, facilitated technique • Generate the list • Prioritize the list • Prepare different lists • Everyone participates by individually ranking the list • Highest ranking will get priority • Application • Prioritize a list of requirements for a release • Prioritize solutions for implementation
Benchmarking • “Process of determining how well your products, services and practices measure up against others” • Against internal units or external competitors • Types of Benchmarking • 1. Process Benchmarking • 2. Product Benchmarking • 3. Performance Benchmarking • Planning phase – Identifying Subject and team, partners & collecting data • Analyze phase – Determine current gap & project future performance level • Integration phase – communicate findings to process owners, get acceptance & establish improvement objectives (generally short term objectives < 1year) • Acton Phase – Develop action plan, implement and monitor progress, recalibrate and reset performance levels Application • Process benchmarking - Industry benchmarks says 53 LOC for 1 FP*. If you have used IFPUG methodology & counted FP for the application you work, can you compare the LOC per FP in your against against the benchmark & improve code quality? This is a benchmarking done at Infosys (* FP – Function Point)
Play script • Work Flow!!!!!! • It is a document that defines the complete requirements or procedure for executing a work • “Play “ writing format • Who does what, when, how etc., • Application • Requirements written as if a story is being narrated • Is use case inspired from this?
C-E Diagram • A Cause-and-Effect Diagram (also known as a "Fishbone Diagram") is a graphical technique for grouping people's ideas about the causes of a problem. • Tool for discovering all the possible causes to a particular effect • Visual depiction of the relation between various causes and effect • Used to refine the outputs from brainstorming session or nominal group technique on a particular problem • Also known as Ishikawa diagram or fishbone diagram • Invented by Ishikawa in 1943 Application • Causal Analysis at Infosys (Picture next slide)
Force Field Analysis Visual tool to determine and understand the forces that can change status quo • Two types of force • Driving force: promote change to desired goal • Restraining force: oppose the change • Developed by Kurt Lewin • Useful to understand variables involved during the implementation of change management • Force people to think together about all the facet of a desired change; encourages creative thinking • Bring agreement with team on relative priority of factors on each side • This provide point for action • Application • Infy wanting to move as a end to end solution provider • Implementing a new idea/process in your project • Implementing metrics program • Selecting a tool
Flow charts & Process maps Pictorial representation of all the sequence of steps of an event,or a process or a work flow Process map is a detailed flowchart which depicts process, their relationships and their owners It uses easily recognizable symbols Application • Process definition • Workflow analysis • Business mapping
Matrix diagram Structured problem solving technique used to show relationship between grouping tool that is used to systematically organize information that must be compared on a variety of characteristics in order to make a comparison, selection or choice Application: • To evaluate the tool availability Vs usage • Make comparisons between competing alternatives that involve multiple characteristics. • To evaluate the list of skill sets of the team • Selection of strategies • Selection of architecture
Quality Function Deployment What is QFD? • Satisfying customer by translating their needs into a design/development This is excellent customer need capturing and translating tool to: • Prioritize spoken and unspoken customer wows, wants, and needs • Translate these needs into technical characteristics and specifications; Developed by Dr Yoji Akao QFD is • Coherent Planning & development tool • Understanding customer requirements • Maximizing the Positive quality that adds value • Comprehensive system to maximize customer satisfaction
Quality Function Deployment Tools uses: Matrix diagram Relations diagrams AHP Process Decision Program Diagram
Quality Function Deployment Full QFD would involves constructing series of matrices • Quality deployment (Planning) • Technology deployment (Design ) • Cost/schedule deployment (Develop) • Reliability deployment ( Deliver ) • Other deployment ( service ) House of Quality Consisting of what, How and How much’s
Quality Function Deployment Horizontal deployment: • Functional • Information • Task Vertical deployment • Technology • Cost/schedule • Reliability • Others
Run Chart • Control Chart • Scatter Plot Tools for Numbers Check sheet Histogram Pareto Chart
Check Sheet • Records the number of occurrences over a specified interval of time to determine the frequency of an event • May follow a pareto to verify a problem or may be input to a pareto • Application • Server monitoring checklists used by CCD in server room • Defect & request trackers used in projects • Checklists used for reviews
Histogram • Bar graph (frequency distribution chart) that groups data by predetermined intervals to show the frequency of the data set • When sufficient process data is available, a histogram displays the central point (average) of the process, variation (standard deviation and range), and shape of distribution • Application • Defect analysis at project level • Generating PCB to understand distribution • Is pareto a Histogram? • Yes, It is ordered in descending scale with the interval as type of defect
Pareto Chart • Special type of histogram, used to view causes of a problem in order of severity from largest to smallest • Graphically shows the 20-80 rule where 20% of the sources cause 80% of the problems. • Joseph Juran refers to this Pareto principle as the separation of the “vital few” from the “trivial many”. • Helps identify common causes of variation (Most common cause in the project is standard & logic defects). By eliminating them, variation is reduced • Application • Defect analysis at Projects • Analysis of failures found in production • Homework • Read defect prevention guidelines in PRIDE to know more about Pareto, Cause & Effect analysis, brainstorming etc.,
Run Chart • A plot of data in chronological order, that displays changes and trends in the central tendency (average). • Often used to monitor and quantify process outputs before a control chart is developed Average Time or Sequence
Control Chart • Objectively identifies process control • Mean + 3 sigma Upper control limit • Mean – 3 sigma Lower control limit • 99.7% of points lie between these limits which is 3 sigma • If we plot +/- 2 sigma it is 95.4% • Following same process, the probability of a new instance to have a value above 3 sigma is practically impossible. Hence such occurrences due to special cause of variation. Can you spot the point with special cause? • Process vary in output. On an average a person can read 50 pages per hour. However it varies between 25 to 75 pages per hour. If a person covers 70 pages an hour, is it due to a common cause of variation or special cause? Question Control chart identifies special cause or common cause?
Scatter diagrams • Problem solving and understanding cause-and-effect relationships • Shows relationship between 2 variables • Also called scatter diagrams or correlation diagrams • Application • Defect level vs. complexity • Defects vs. skill levels (training) • Defect level vs. effort variation • Appraisal cost vs. effort deviation
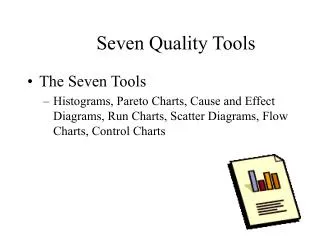
7 QC tools • Brainstorming • Flow charts • Cause-and-effect diagram • Histograms • Pareto Charts • Control charts • Scatter diagrams
Bar chart • Stem and Leaf chart Tools for Presentation This presentation doesn’t explain these tools in detail as they are straight forward. Table Line chart Pie Chart
Sample objective & subjective questions… Objective Questions • The objective to select the most frequent cause/causes of a problem in order to direct action to eliminate those causes is achieved by • If a bar chart is seen arranged in the descending order of frequencies, then you are seeing a _________________ • A ‘Run Chart’ can be used to identify the cause of defects (True/False) • Tool used in CMMI Level 4 • Pareto chart • Control Chart • Can random or inherent causes be eliminated? • Name the tool where data collected is recorded? • A flow chart that shows relationships between processes and process owners is _____________ • QFD was developed by • Most frequently used QC tool • Difference between a flow chart & a process map? Subjective Questions • 25 failures with their reasons are given. Will you be able to draw a pareto? • An organization finds it difficult to motivate its employees to follow processes. What quality tools will you use to analyze the problem & explain • You are assigned the quality assurance manager of a company. Currently the processes followed are very adhoc and there are too many issues in the deliverables. How will you go about?