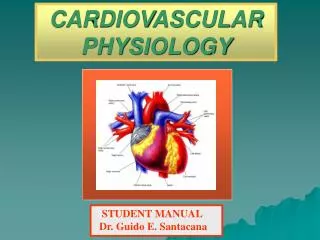
Cardiovascular Physiology
Cardiovascular Physiology. 14. Structure of the Heart. The heart valves ensure one-way flow. Figure 14-7g. Heart Valves. PLAY. Animation: Cardiovascular System: Anatomy Review: The Heart. Figure 14-9. Heart Valves. Histology of Myocardium. Involuntary muscle Striated, has sarcomeres

Cardiovascular Physiology
E N D
Presentation Transcript
Structure of the Heart The heart valves ensure one-way flow Figure 14-7g
Heart Valves PLAY Animation: Cardiovascular System: Anatomy Review: The Heart Figure 14-9
Histology of Myocardium • Involuntary muscle • Striated, has sarcomeres • Many mitochondria • Uni- or binucleated • Branched • Intercalated Disc • Rhythmic contractions • Does not fatigue as easily as skeletal • Does not have individual neuromuscular junctions • Independent contractions • Require high O2
Cardiac Muscle versus Skeletal Muscle • Smaller and have single nucleus per fiber • Have intercalated disks • Desmosomes allow force to be transferred • Gap Junctions provide electrical connection • T-tubules are larger and branch • Sarcoplasmic reticulum is smaller • Mitochondria occupy one-third of cell volume
Excitation-contraction coupling and relaxation in cardiac muscle 1 Action potential enters from adjacent cell. Ca2+ ECF 1 2 Voltage-gated Ca2+ channels open. Ca2+ enters cell. ICF Ryanodine receptor-channel 3 Ca2+ induces Ca2+ release through ryanodine receptor-channels (RyR). 2 3 SR Sarcoplasmic reticulum (SR) 4 Local release causes Ca2+ spark. Ca2+ T-tubule 5 Summed Ca2+ Sparks create a Ca2+ signal. 4 Ca2+ spark Ca2+ ions bind to troponin to initiate contraction. 6 5 Ca2+ signal 6 Contraction Figure 14-11, steps 1–6
Excitation-contraction coupling and relaxation in cardiac muscle 1 Action potential enters from adjacent cell. Ca2+ ECF 1 2 Voltage-gated Ca2+ channels open. Ca2+ enters cell. ICF Ryanodine receptor-channel 3 Ca2+ induces Ca2+ release through ryanodine receptor-channels (RyR). 2 3 SR Sarcoplasmic reticulum (SR) Ca2+ stores 4 Local release causes Ca2+ spark. Ca2+ T-tubule 5 Summed Ca2+ Sparks create a Ca2+ signal. 4 ATP Ca2+ spark Ca2+ 8 Ca2+ ions bind to troponin to initiate contraction. 6 5 7 Relaxation occurs when Ca2+ unbinds from troponin. Ca2+ signal Ca2+ 8 Ca2+ is pumped back into the sarcoplasmic reticulum for storage. 7 6 Actin Myosin Relaxation Contraction Figure 14-11, steps 1–8
Excitation-contraction coupling and relaxation in cardiac muscle 9 10 1 Action potential enters from adjacent cell. Ca2+ Ca2+ 3 Na+ 2 K+ ECF 1 ATP 2 Voltage-gated Ca2+ channels open. Ca2+ enters cell. ICF 3 Na+ Ryanodine receptor-channel Ca2+ 3 Ca2+ induces Ca2+ release through ryanodine receptor-channels (RyR). 2 3 SR Sarcoplasmic reticulum (SR) Ca2+ stores 4 Local release causes Ca2+ spark. Ca2+ T-tubule 5 Summed Ca2+ Sparks create a Ca2+ signal. 4 ATP Ca2+ spark Ca2+ 8 Ca2+ ions bind to troponin to initiate contraction. 6 5 7 Relaxation occurs when Ca2+ unbinds from troponin. Ca2+ signal Ca2+ 8 Ca2+ is pumped back into the sarcoplasmic reticulum for storage. 7 6 Actin 9 Ca2+ is exchanged with Na+. 10 Na+ gradient is maintained by the Na+-K+-ATPase. Myosin Relaxation Contraction Figure 14-11, steps 1–10
Myocardial Contractile Cells PX = Permeability to ion X PNa 1 +20 2 PK and PCa 0 -20 PK and PCa 3 0 -40 Membrane potential (mV) PNa -60 -80 4 4 -100 0 100 200 300 Time (msec) Phase Membrane channels 0 Na+ channels open 1 Na+ channels close 2 Ca2+ channels open; fast K+ channels close 3 Ca2+ channels close; slow K+ channels open 4 Resting potential Action potential of a cardiac contractile cell Resting membrane potential is -90mv. Na+ passes through double gated voltage channels Plateau results from decreased K+ and increased Ca++ Plateau end when flux is reversed Figure 14-13
Myocardial Contractile Cells Refractory periods and summation in skeletal and cardiac muscle- this prevents summation as it happens in skeletal muscle Figure 14-14c
Modulation of Heart Rate by the Nervous System Sympathetic stimulation targets If channels to open rapidly. Parasympathetic stimuation targets K+ and Ca++ channels, it hyper-polarizes the cell and slows depolarization Figure 14-16
Electrical Conduction in Myocardial Cells 1% of myocardial cells are designed to spontaneously generate an action potential. They can contract without outside signal= autorhythmic. Pacemaker cells do not have sarcomeres Figure 14-17
Electrical Conduction in Heart 1 1 SA node AV node 2 1 THE CONDUCTING SYSTEM OF THE HEART SA node depolarizes. 2 Electrical activity goes rapidly to AV node via internodal pathways. SA node 3 Internodal pathways 3 Depolarization spreads more slowly across atria. Conduction slows through AV node. AV node 4 Depolarization moves rapidly through ventricular conducting system to the apex of the heart. A-V bundle 4 Bundle branches Purkinje fibers Depolarization wave spreads upward from the apex. 5 5 Purple shading in steps 2–5 represents depolarization. Figure 14-18
Electrical Conduction & Einthoven’s Triangle • AV node • Direction of electrical signals • Delay the transmission of action potentials • SA node • Set the pace of the heartbeat at 70 bpm • AV node (50 bpm) and Purkinje fibers (25-40 bpm) can act as pacemakers under some conditions
Electrical Activity Comparison of an ECG and a myocardial action potential Figure 14-22
The Electrocardiogram ECG give info on heart rate, heart rhythm, conduction velocity, and heart condition. Three major waves: P wave, QRS complex, and T wave Waves correspond to events of the cardiac cycle. Figure 14-20
Electrical Activity P wave: atrial depolarization START P The end R PQ or PR segment: conduction through AV node and A-V bundle T P P QS Atria contract. T wave: ventricular Repolarization ELECTRICAL EVENTS OF THE CARDIAC CYCLE Repolarization R T P QS Q wave P Q ST segment R R wave P R Q S P R Ventricles contract. Q P S wave QS Correlation between an ECG and electrical events in the heart Figure 14-21
Electrical Activity P wave: atrial depolarization START P PQ or PR segment: conduction through AV node and A-V bundle P Atria contract. ELECTRICAL EVENTS OF THE CARDIAC CYCLE The P wave reflects the activity of the atria. The atria contract from top to bottom so the P-wave ends after full atrial depolarization Figure 14-21 (2 of 9)
Electrical Activity P wave: atrial depolarization START P PQ or PR segment: conduction through AV node and A-V bundle P Atria contract. ELECTRICAL EVENTS OF THE CARDIAC CYCLE Q wave P Q The P-Q segment reflects the flow of current along the interventricular septum via the AV node and AV bundle. This is the time when the ventricles are relaxed and filling with blood Figure 14-21 (3 of 9)
Electrical Activity P wave: atrial depolarization START P PQ or PR segment: conduction through AV node and A-V bundle P Atria contract. ELECTRICAL EVENTS OF THE CARDIAC CYCLE Q wave P Q ST segment R R wave P R Q S P R Ventricles contract. Q P S wave QS The QRS complex occurs while the ventricles contraction (depolarize) from the apex & upwards. At the end of the contraction all blood volume to be expelled as been pushed out. S-T segment happens during ventricular repolarization (relax) Figure 14-21 (6 of 9)
Electrical Activity The T-wave indicates ventricular repolarization- meaning that the muscle is coming back to a resting state. At this point the chambers are ready to receive blood P wave: atrial depolarization START P The end R PQ or PR segment: conduction through AV node and A-V bundle T P P QS Atria contract. T wave: ventricular Repolarization ELECTRICAL EVENTS OF THE CARDIAC CYCLE Repolarization R T P QS Q wave P Q ST segment R R wave P R Q S P R Ventricles contract. Q P S wave QS Figure 14-21 (9 of 9)
Electrical Activity Normal and abnormal electrocardiograms Figure 14-23
Mechanical Events Late diastole: both sets of chambers are relaxed and ventricles fill passively. 1 START Isovolumic ventricular relaxation: as ventricles relax, pressure in ventricles falls, blood flows back into cups of semilunar valves and snaps them closed. 5 Atrial systole: atrial contraction forces a small amount of additional blood into ventricles. 2 Isovolumic ventricular contraction: first phase of ventricular contraction pushes AV valves closed but does not create enough pressure to open semilunar valves. 3 Ventricular ejection: as ventricular pressure rises and exceeds pressure in the arteries, the semilunar valves open and blood is ejected. 4 Mechanical events of the cardiac cycle PLAY Animation: Cardiovascular System: Cardiac Cycle Figure 14-24
Mechanical Events Late diastole: both sets of chambers are relaxed and ventricles fill passively. 1 START Atrial systole: atrial contraction forces a small amount of additional blood into ventricles. 2 Figure 14-24, steps 1–2
Mechanical Events Late diastole: both sets of chambers are relaxed and ventricles fill passively. 1 START Atrial systole: atrial contraction forces a small amount of additional blood into ventricles. 2 Isovolumic ventricular contraction: first phase of ventricular contraction pushes AV valves closed but does not create enough pressure to open semilunar valves. 3 Figure 14-24, steps 1–3
Mechanical Events Late diastole: both sets of chambers are relaxed and ventricles fill passively. 1 START Atrial systole: atrial contraction forces a small amount of additional blood into ventricles. 2 Isovolumic ventricular contraction: first phase of ventricular contraction pushes AV valves closed but does not create enough pressure to open semilunar valves. 3 Ventricular ejection: as ventricular pressure rises and exceeds pressure in the arteries, the semilunar valves open and blood is ejected. 4 Figure 14-24, steps 1–4
Mechanical Events Late diastole: both sets of chambers are relaxed and ventricles fill passively. 1 START Isovolumic ventricular relaxation: as ventricles relax, pressure in ventricles falls, blood flows back into cups of semilunar valves and snaps them closed. 5 Atrial systole: atrial contraction forces a small amount of additional blood into ventricles. 2 Isovolumic ventricular contraction: first phase of ventricular contraction pushes AV valves closed but does not create enough pressure to open semilunar valves. 3 Ventricular ejection: as ventricular pressure rises and exceeds pressure in the arteries, the semilunar valves open and blood is ejected. 4 Figure 14-24, steps 1–5
Cardiac Cycle KEY EDV = End-diastolic volume ESV = End-systolic volume Stroke volume 120 D ESV 80 C One cardiac cycle Left ventricular pressure (mm Hg) 40 EDV B A 0 65 100 135 Left ventricular volume (mL) Left ventricular pressure-volume changes during one cardiac cycle Figure 14-25
Cardiac Cycle KEY EDV = End-diastolic volume ESV = End-systolic volume 120 80 Left ventricular pressure (mm Hg) 40 A 0 65 100 135 Left ventricular volume (mL) At the beginning of the diastolic phase the ventricles are relax and contain a very small amount of blood Figure 14-25 (1 of 4)
Cardiac Cycle KEY EDV = End-diastolic volume ESV = End-systolic volume 120 80 Left ventricular pressure (mm Hg) 40 EDV B A 0 65 100 135 Left ventricular volume (mL) At then of the diastolic phase the volume as increased because the ventricle has filled after the ventricles contracted Figure 14-25 (2 of 4)
Cardiac Cycle KEY EDV = End-diastolic volume ESV = End-systolic volume 120 80 C Left ventricular pressure (mm Hg) 40 EDV B A 0 65 100 135 Left ventricular volume (mL) At point C (systole phase) the pressure has increased but the volume has not changed Figure 14-25 (3 of 4)
Cardiac Cycle KEY EDV = End-diastolic volume ESV = End-systolic volume Stroke volume 120 D ESV 80 C Left ventricular pressure (mm Hg) One cardiac cycle 40 EDV B A 0 65 100 135 Left ventricular volume (mL) At the end of systole the pressure is at is highest and the volume has dropped. Stroke volume= EDV - ESV Figure 14-25 (4 of 4)
Wiggers Diagram Time (msec) 0 100 200 300 400 500 600 700 800 QRS complex QRS complex Electro- cardiogram (ECG) Cardiac cycle P T P 120 90 Aorta Dicrotic notch Pressure (mm Hg) Left ventricular pressure 60 Left atrial pressure 30 S2 S1 Heart sounds 135 Left ventricular volume (mL) 65 Atrial systole Ventricular systole Atrial systole Ventricular diastole Atrial systole Atrial systole Isovolumic ventricular contraction Ventricular systole Late ventricular diastole Early ventricular diastole This diagram shows the relationship between the cardiac cycle, the ECG, the heart sounds, and pressure changes in the left ventricle and aorta Figure 14-26
Wiggers Diagram Time (msec) 0 100 200 300 400 500 600 700 800 Electro- cardiogram (ECG) QRS complex Cardiac cycle QRS complex P T P Atrial systole Ventricular systole Atrial systole Ventricular diastole Atrial systole Isovolumic ventricular contraction Ventricular systole Early ventricular diastole Late ventricular diastole Atrial systole This shows the correlation between the carciac cycle and the ECG. Notice between the T wave of one and P wave of another the ventricles are relaxed while the atria are filling and beginning to empty prior to atrial depolarization Figure 14-26
Wiggers Diagram Time (msec) 0 100 200 300 400 500 600 700 800 135 Left ventricular volume (mL) 65 Atrial systole Ventricular systole Atrial systole Ventricular diastole Atrial systole Isovolumic ventricular contraction Ventricular systole Early ventricular diastole Late ventricular diastole Atrial systole This phase shows the changes in blood volume as the ventricle contracts (depolarizes) or relaxes (repolarizes) Figure 14-26
Wiggers Diagram Time (msec) 0 100 200 300 400 500 600 700 800 90 Pressure (mm Hg) 60 30 Left atrial pressure 135 Left ventricular volume (mL) 65 Atrial systole Ventricular systole Atrial systole Ventricular diastole Atrial systole Isovolumic ventricular contraction Ventricular systole Early ventricular diastole Late ventricular diastole Atrial systole You can see the relationship between pressure chages in teh atrium and the cardiac cycle. Notice that the lowest atrial pressure is during ventricular diastole. Figure 14-26
Wiggers Diagram Time (msec) 0 100 200 300 400 500 600 700 800 120 90 Pressure (mm Hg) Left ventricular pressure 60 30 S2 S1 Heart sounds 135 Atrial systole Ventricular systole Atrial systole Ventricular diastole Atrial systole Isovolumic ventricular contraction Ventricular systole Early ventricular diastole Late ventricular diastole Atrial systole This shows changes in ventricular pressure and valve sounds as the AV valve (S1) and semilunar valves (S2) close. Figure 14-26
Wiggers Diagram Time (msec) 0 100 200 300 400 500 600 700 800 90 Pressure (mm Hg) 60 Left ventricular pressure 30 135 Left ventricular volume (mL) S2 S1 65 Atrial systole Ventricular systole Atrial systole Ventricular diastole Atrial systole Isovolumic ventricular contraction Ventricular systole Early ventricular diastole Late ventricular diastole Atrial systole This shows changes in ventricular pressure and ventricular blood volume. Figure 14-26
Wiggers Diagram Time (msec) 0 100 200 300 400 500 600 700 800 120 90 Aorta Dicrotic notch Pressure (mm Hg) Left ventricular pressure 60 30 S2 S1 Heart sounds Atrial systole Ventricular systole Atrial systole Ventricular diastole Atrial systole Ventricular systole Atrial systole Isovolumic ventricular contraction Early ventricular diastole Late ventricular diastole The top line shows changes in pressure of the aorta as the left ventricle contracts or relaxes. The dicrotic notch occurs as a sharp drop in pressure results from a drop in blood flow once the ventricle begins to relax Figure 14-26
Wiggers Diagram Time (msec) 0 100 200 300 400 500 600 700 800 120 90 Aorta Dicrotic notch Pressure (mm Hg) Left ventricular pressure 60 Left atrial pressure 30 S2 S1 Heart sounds Atrial systole Ventricular systole Atrial systole Ventricular diastole Atrial systole Ventricular systole Atrial systole Isovolumic ventricular contraction Early ventricular diastole Late ventricular diastole Figure 14-26
Wiggers Diagram Time (msec) 0 100 200 300 QRS complex Electro- cardiogram (ECG) P T 120 90 Aorta Pressure (mm Hg) Left ventricular pressure 60 Left atrial pressure 30 S1 Heart sounds 135 Left ventricular volume (mL) 65 Atrial systole Ventricular systole Ventricular systole This shows all the events that are happening during one complete ECG wave Figure 14-26
Wiggers Diagram Time (msec) 0 100 200 300 400 500 600 700 800 QRS complex Electro- cardiogram (ECG) Cardiac cycle P T 120 90 Aorta Dicrotic notch Pressure (mm Hg) Left ventricular pressure 60 Left atrial pressure 30 S2 S1 Heart sounds 135 Left ventricular volume (mL) 65 Atrial systole Ventricular systole Ventricular diastole Late ventricular diastole This shows all the changes happening during ventricular diastole Figure 14-26
Wiggers Diagram Time (msec) 0 100 200 300 400 500 600 700 800 QRS complex QRS complex Electro- cardiogram (ECG) Cardiac cycle P T P 120 90 Aorta Dicrotic notch Pressure (mm Hg) Left ventricular pressure 60 Left atrial pressure 30 S2 S1 Heart sounds 135 Left ventricular volume (mL) 65 Atrial systole Ventricular systole Atrial systole Ventricular diastole Isovolumic ventricular contraction Ventricular systole Early ventricular diastole Late ventricular diastole Atrial systole Atrial systole These are all the events during one complete cardiac cycle Figure 14-26