Human Cognition Process & Perception in Visualization
Human Cognition Process & Perception in Visualization. August 12, 2005. Visualization. Meant “constructing a visual image in the mind” Shorter Oxford English Dictionary Now it has come to mean something more like a “graphical representation of data or concepts”. Information Visualization.

Human Cognition Process & Perception in Visualization
E N D
Presentation Transcript
Human Cognition Process & Perception in Visualization August 12, 2005
Visualization Meant “constructing a visual image in the mind” • Shorter Oxford English Dictionary Now it has come to mean something more like a “graphical representation of data or concepts”
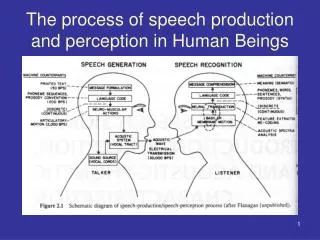
Information Visualization Advances in science & technology have allowed people to see old things in new ways. Telescopes, microscopes and oscilloscopes are typical instrument examples. 现代科学技术允许人们用新的方法来看旧的事物. 例如天文望远镜, 显微镜 …. Maps, diagrams, and PERT charts are examples of using visual representations to see things. A good picture is worth ten thousand words. 一个好的图画所能表达的东西胜过十万个字 Today, computers help people to see and understand abstract data through pictures.
Pictures as Sensory Languages • Similarity between pictures and the things that they represent • The evidence related to whether or not we must learn to see pictures • The issue of how pictures, and especially line drawings, are able to unambiguously represent things • Are we able to understand certain pictures without learning ?
Presenting relational structures r1 r1, r2, r3 A B A B r3 r2 D C D C Two different graphical methods for showing relationships between entities.
Presenting relational structures • The lines that connect the various components are a notation that is easy to read, because the visual cortex of the brain contains mechanisms specifically designed to seek out continuous contours. • Other possible graphical notations for showing connectivity would be far less effective.
Visual Principles • Sensory vs. Arbitrary Symbols • Pre-attentive Properties • Simple Visual forms & Presentations
Sensory vs. Arbitrary Symbols • Sensory: • The word refers to symbols and aspects of visualization that derive their expressive power from their ability to use the perceptual processing power of the brain without learning • Arbitrary • The word refers to aspects of representation that must be learned, having no perceptual basis • E.g. the written word dog bears no perceptual relationship to any actual animal
Sensory vs. Arbitrary Symbols • Sensory: • Sensory representations are effective because they are well matched to the early stage of neural processing. They tend to be stable across individuals and cultures and time. • Arbitrary • Arbitrary conventions derive their power from culture and are therefore dependent on the particular cultural milieu or an individual.
Sensory vs. Arbitrary Symbols • Sensory: • Understanding without training • Resistance to instructional bias • Sensory immediacy • Hard-wired and fast • Cross-cultural Validity • Arbitrary • Hard to learn • Easy to forget • Embedded in culture and applications
American Sign Language • Primarily arbitrary, but partly representational • Signs sometimes based partly on similarity • But you couldn’t guess most of them • Sublanguages in ASL are more representative • Describing the layout of a room, there is a way to indicate by pointing on a plane where different items sit.
Pre-attentive Processing • A limited set of visual properties are processed pre-attentively • (without need for focusing attention). • This is important for design of visualizations • what can be perceived immediately • what properties are good discriminators • what can mislead viewers
Example: Color Selection Viewer can rapidly and accurately determine whether the target (red circle) is present or absent. Difference detected in color.
Example: Shape Selection Viewer can rapidly and accurately determine whether the target (red circle) is present or absent. Difference detected in form
Pre-attentive Processing • Identifying (or detection) tasks are performed with: • < 200 - 250ms qualifies as pre-attentive • eye movements take at least 200ms • yet certain processing can be done very quickly, implying low-level processing in parallel • If a decision takes a fixed amount of time regardless of the number of distractors, it is considered to be pre-attentive.
Example: Conjunction of Features Viewer cannotrapidly and accurately determine whether the target (red circle) is present or absent when target has two or more features, each of which are present in the distractors. Viewer must search sequentially.
Example: Emergent Features Target has a unique feature with respect to distractors (open sides) and so the group can be detected preattentively.
Example: Emergent Features Target does not have a unique feature with respect to distractors and so the group cannot be detected preattentively.
Asymmetric and Graded Preattentive Properties • Some properties are asymmetric • a sloped line among vertical lines is preattentive • a vertical line among sloped ones is not • Some properties have a gradation • some more easily discriminated among than others
Use Grouping of Well-Chosen Shapes for Displaying Multivariate Data
SUBJECT PUNCHED QUICKLY OXIDIZED TCEJBUS DEHCNUP YLKCIUQ DEZIDIXO CERTAIN QUICKLY PUNCHED METHODS NIATREC YLKCIUQ DEHCNUP SDOHTEM SCIENCE ENGLISH RECORDS COLUMNS ECNEICS HSILGNE SDROCER SNMULOC GOVERNS PRECISE EXAMPLE MERCURY SNREVOG ESICERP ELPMAXE YRUCREM CERTAIN QUICKLY PUNCHED METHODS NIATREC YLKCIUQ DEHCNUP SDOHTEM GOVERNS PRECISE EXAMPLE MERCURY SNREVOG ESICERP ELPMAXE YRUCREM SCIENCE ENGLISH RECORDS COLUMNS ECNEICS HSILGNE SDROCER SNMULOC SUBJECT PUNCHED QUICKLY OXIDIZED TCEJBUS DEHCNUP YLKCIUQ DEZIDIXO CERTAIN QUICKLY PUNCHED METHODS NIATREC YLKCIUQ DEHCNUP SDOHTEM SCIENCE ENGLISH RECORDS COLUMNS ECNEICS HSILGNE SDROCER SNMULOC
Text NOT Preattentive SUBJECT PUNCHED QUICKLY OXIDIZED TCEJBUS DEHCNUP YLKCIUQ DEZIDIXO CERTAIN QUICKLY PUNCHED METHODS NIATREC YLKCIUQ DEHCNUP SDOHTEM SCIENCE ENGLISH RECORDS COLUMNS ECNEICS HSILGNE SDROCER SNMULOC GOVERNS PRECISE EXAMPLE MERCURY SNREVOG ESICERP ELPMAXE YRUCREM CERTAIN QUICKLY PUNCHED METHODS NIATREC YLKCIUQ DEHCNUP SDOHTEM GOVERNS PRECISE EXAMPLE MERCURY SNREVOG ESICERP ELPMAXE YRUCREM SCIENCE ENGLISH RECORDS COLUMNS ECNEICS HSILGNE SDROCER SNMULOC SUBJECT PUNCHED QUICKLY OXIDIZED TCEJBUS DEHCNUP YLKCIUQ DEZIDIXO CERTAIN QUICKLY PUNCHED METHODS NIATREC YLKCIUQ DEHCNUP SDOHTEM SCIENCE ENGLISH RECORDS COLUMNS ECNEICS HSILGNE SDROCER SNMULOC
Preattentive Visual Properties(Healey 97) length Triesman & Gormican [1988] width Julesz [1985] size Triesman & Gelade [1980] curvature Triesman & Gormican [1988] number Julesz [1985]; Trick & Pylyshyn [1994] terminators Julesz & Bergen [1983] intersection Julesz & Bergen [1983] closure Enns [1986]; Triesman & Souther [1985] colour (hue) Nagy & Sanchez [1990, 1992]; D'Zmura [1991] Kawai et al. [1995]; Bauer et al. [1996] direction of motion Nakayama & Silverman [1986]; Driver & McLeod [1992] stereoscopic depth Nakayama & Silverman [1986] 3-D depth cues Enns [1990] lighting direction Enns [1990]
Color Most of this segment taken from Colin Ware, Ch. 4
Color Issues • Complexity of color space • 3-dimensional • Computer vs. Print display • There are many models and standards • Color not critical for many visual tasks • Doesn’t help with determination of: • Layout of objects in space • Motion of objects • Shape of objects • Color-blind people often go for years without knowing about their condition • Color is essential for • “breaking camouflage” • Recognizing distinctions • Picking berries out from leaves • Spoiled meat vs. good • Aesthetics
Color Palettes for Computer Tools From Powerpoint
Colors for Labeling • Ware’s recommends to take into account: • Distinctness • Unique hues • Component process model • Contrast with background • Color blindness • Number • Only a small number of codes can be rapidly perceived • Field Size • Small changes in color are difficult to perceive • Conventions
Small Color Patches More Difficult to Distinguish Images from lecture by Terrance Brooke
Ware’s Recommended Colors for Labeling Red, Green, Yellow, Blue, Black, White, Pink, Cyan, Gray, Orange, Brown, Purple. The top six colors are chosen because they are the unique colors that mark the ends of the opponent color axes. The entire set corresponds to the eleven color names found to be the most common in a cross-cultural study, plus cyan (Berlin and Kay) Slide adapted from Terrance Brooke
Which Properties & Forms are Appropriate for Which Information Types?
Accuracy Ranking of Quantitative Perceptual TasksEstimated; only pairwise comparisons have been validated(Mackinlay 88 from Cleveland & McGill)
Interpretations of Visual Properties Some properties can be discriminated more accurately but don’t have intrinsic meaning (Senay & Ingatious 97, Kosslyn, others) • Density (Greyscale) Darker -> More • Size / Length / Area Larger -> More • Position Leftmost -> first, Topmost -> first • Hue ??? no intrinsic meaning • Slope ??? no intrinsic meaning
A Chart is: • A visual display that illustrates one or more relationships among entities • A shorthand way to present information • Allows a trend, pattern, or comparison to be easily apprehended
Types of Symbolic Displays • Charts • Graphs • Maps • Diagrams
Types of Symbolic Displays • Charts • at least two scales required • values associated by a symmetric “paired with” relation • Examples: scatter-plot, bar-chart, layer-graph
Types of Symbolic Displays Graphs • discrete relations among discrete entities • structure relates entities to one another • lines and relative position serve as links Examples: family tree flow chart network diagram
Types of Symbolic Displays • Maps • internal relations determined (in part) by the spatial relations of what is pictured • labels paired with locations Examples: map of census data topographic maps From www.thehighsierra.com
length of page length of access Common Chart Types # of accesses # of accesses length of access URL url 1 url 2 url 3 url 4 url 5 url 6 url 7 45 40 35 # of accesses 30 length of access 25 20 15 10 5 0 long long very short # of accesses medium days length of page
Classical Graph Types hierarchical orthogonal symmetric
References: • Chapters 1, 3, 4 of the book “Information Visualization – Perception for Design”, Colin Ware, Morgan Kaufmann Publisher, 1999. • “Perception in Visualization”, Christopher G. Healey.