
Uploaded by
oni
1 SLIDES
188 VUES
10LIKES
100
DESCRIPTION
1. 120. 2. 100. 3. 4. 80. 5. 60. 6. Number of HVPs. 7. 40. 8. 20. 9. 10. 0. 11. >1.0. >0.5. >0.2. >0.1. 12. Variance. Supplementary Figure 1. Number of High Variance Probe sets (HVPs) on rice chromosomes at different variance levels in Pavon vs Dt1BL comparison.
Download
1 / 1
Télécharger la présentation 
100
An Image/Link below is provided (as is) to download presentation
Download Policy: Content on the Website is provided to you AS IS for your information and personal use and may not be sold / licensed / shared on other websites without getting consent from its author.
Content is provided to you AS IS for your information and personal use only.
Download presentation by click this link.
While downloading, if for some reason you are not able to download a presentation, the publisher may have deleted the file from their server.
During download, if you can't get a presentation, the file might be deleted by the publisher.
E N D
Presentation Transcript
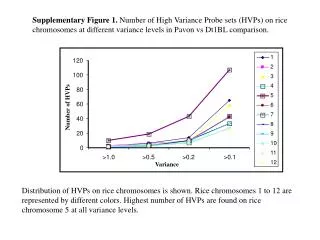
1 120 2 100 3 4 80 5 60 6 Number of HVPs 7 40 8 20 9 10 0 11 >1.0 >0.5 >0.2 >0.1 12 Variance Supplementary Figure 1. Number of High Variance Probe sets (HVPs) on rice chromosomes at different variance levels in Pavon vs Dt1BL comparison. Distribution of HVPs on rice chromosomes is shown. Rice chromosomes 1 to 12 are represented by different colors. Highest number of HVPs are found on rice chromosome 5 at all variance levels.


More Related