Handy Handouts:
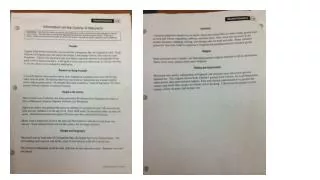
Handy Handouts:. THE ANSWERS. Ninth Edition. Abiqua Acres. WEIGHTED AVERAGE METHOD. Abiqua Acres (p. 2). FIFO METHOD. E.U. WIP Units. DM. CC. DM 100% 100%. CC 40% 50%. BI IN EI. 5,000 60,000 8,000. 57,000. Out. BI: (DM) 5,000 × 0% BI: (CC) 5,000×60% Start & Finish


Handy Handouts:
E N D
Presentation Transcript
Handy Handouts: THE ANSWERS Ninth Edition
Abiqua Acres WEIGHTED AVERAGE METHOD
Abiqua Acres (p. 2) FIFO METHOD E.U. WIP Units DM CC DM 100% 100% CC 40% 50% BI IN EI 5,000 60,000 8,000 57,000 Out BI: (DM) 5,000× 0% BI: (CC) 5,000×60% Start & Finish EI: (DM) 8,000×100% EI: (CC) 8,000× 50% E.U. - 0 - 52,000 8,000 60,000 3,000 52,000 4,000 59,000 WIP - $ (FIFO) Costs to Account For Out BI DM $20,000 CC $16,000 DM $250,000 CC $450,000 DM $33,333.60 CC 30,508.40 $63,842.00 DM CC Total $ 36,000.00 from BI 22,881.30 Finished CC 5,000×60%×$7.6271 613,277.60 S&F 52,000 × $11.7938 $672,158.90 $ per EU BI $20,000 DM ÷ (5,000×100%) $16,000 CC ÷ (5,000× 40%) $4.00 $8.00 $12.00 IN $ per EU IN EI = 8,000 × 100% × $4.1667 = 8,000 × 50% × $7.6271 $250,000 DM ÷ 60,000 E.U. $450,000 CC ÷ 59,000 E.U. $4.1667 $7.6271 $11.7938 $736,000 Costs to Account For (Info we need to do problem)
Abtex Electronics 1. $280,000+ $1,040,000 FC 120,000 units = = BE(units) = CM per unit $11.00 80,000 Electronic Calculators 40,000 Tape Recorders
Abtex Electronics (cont.) 2. Tape Recorders Electronic Calculators DM $4.00 × 90% = DL $2.00 × 110% = VOH Total VC per unit $3.60 2.20 2.00 $7.80 DM $4.50 × 80% = DL $3.00 × 110% = VOH Total VC per unit $3.60 3.30 2.00 $8.90 Total Fixed Costs: $ 280,000 1,040,000 57,000 $1,377,000 I made up a big number for “revenue”, likely to be divisible by both $15.00 and $20.00, the 1998 selling prices Sales Mix Calculation: $750,000 Estimated 1998 mix of revenue 20% 80% $150,000 Rev. SP $15 per unit 10,000 recorders $600,000 Rev. SP $20 per unit 30,000 calculators SALES MIX IN UNITS ¼ ¾
Abtex Electronics (cont.) (Continued) 2. FC $1,377,000 136,000 units = = BE(units) = CM per unit $10.125 ¼ ¾ 108,800 Electronic Calculators 27,200 Tape Recorders
Adams Co. Has 80,000 lbs. of RM available No more can be purchased Bicycle Frames $40/unit CM, requires 8 lbs. of RM Set of Golf Clubs $32/unit CM, requires 4 lbs. of RM ** Everything they make can be sold!! Bike Frames $40 / 8 lbs. = $5.00 per lb. CM Golf Clubs $32 / 4 lbs. = $8.00 per lb. CM 80,000 lbs. of RM available ÷ 4 lbs. per Set of Golf Clubs = 20,000 Sets of Golf Clubs produced to maximize CM ** What if they can only sell 8,000 Sets of Golf Clubs?? Make 8,000 Sets of Golf Clubs 32,000 lbs. Make 6,000 Bicycle Frames 48,000 lbs. (= 48,000 lbs. / 8 lbs. per unit) 80,000 lbs.
Alcatraz Artifacts 1. Wtd. Avg. CM Wtd. Avg. SP SP VC CM Mix Al $20 $16 $4 2/10 $.80 $ 4.00 Cat $50 $36 $14 3/10 $4.20 $15.00 Raz $40 $28 $12 5/10 $6.00 $20.00 $11.00 $39.00 BE (units) = FC = $77,000 = 7000 units CM per unit $11 ALCATRAZ 20% 30% 50% 1400 + 2100 + 3500 = $7000 $28,000 + $105,000 + $140,000 = $273,000 “Al” “Cat” “Raz”
Alcatraz Artifacts (cont.) WTD. AVG. SPVCCMMIXCM Al $20 $16 $4 .40 $1.60 Cat $50 $36 $14 .40 $5.60 Raz $40 $28 $12 .20 $2.40 $9.60 2. BE (units) = FC = $77,000 = 8021 units CM per units $9.60 AlCatRaz 40% + 40% + 20% 3,209 + 3208 + 1,604 $64,180 + $160,400 + $64,160 = $288,740 Increased BE point because more low profit “Al’s” were sold.
Apple Appliances You should reject the offer. $10 Variable (relevant) cost to produce the timer assemblies ($5 + $4 + $1) $12 Cost to purchase the timer assemblies $ 2 Cheaper to make the timer assemblies
Archer Company a. UNITS UNITS UNITS UNITS FG - June FG - Mar FG - April FG - May 6000 32,000 BI 8000 Produce 44,000 Produce 60,000 30,000 40,000 6000 8,000 EI 12,000 (20% x 60,000) (20% x 40,000) RM UNITS RM - May RM UNITS RM - April RM UNITS FG - June b. 44,000 x 3 = 132,000 24,000 lbs. Purchase 105,000 lbs. 32,000 x 3 = 96,000 lbs, 33,000 lbs. (25% x 132,000)
Astoria Company RM WIP FG BI Purch EI $ 9,000 $40,000 $11,000 $32,300 (85%) $ 5,700 (15%) $ 20,000 32,300 45,000 64,200 $ 21,500 BI EI $ 32,000 140,000 $ 42,000 BI EI $ 130,000 COGS COGM $140,000 DL COGS $ 45,000 - 0 - $ 45,000 $ 130,000 $ 130,000 - 0 - MOH IDM Mfg Utilities Mfg Depr IDL Prepd Insur $ 5,700 19,100 27,000 10,000 2,400 64,200 I/S $ 250,000 Sales COGS Depr. Exp. Adv. Exp. Admin. Salaries Prepaid Ins. Misc. S&A $ 130,000 9,000 48,000 30,000 600 9500 $ 64,200 - 0 - $ 22,900 NI BT Inc. Tax $ 4,580 $ 18,320 NI AT (to R/E) $ 18,320 - 0 -
Assets (aka: “Pete”) Astoria Co. (p. 2) CASH A/R Property, Plant & Equip $ 7,000 245,000 $34,820 Beg End $ 19,100 48,000 9,500 2,000 41,000 84,000 9,000 4,580 Util Advertsng Misc S&A Prepd Ins A/P W/P Purch PPE Inc Tax Beg End $ 18,000 250,000 $ 23,000 Beg End $ 290,000 9,000 $ 219,000 Purch of Equip (Sales) $ 245,000 (to Cash) Cash from Customers((A/R)) Prepaid Insurance Accum. Depr. Beg End $ 4,000 2,000 $ 3,000 $ 3,000 $ 53,000 36,000 $ 89,000 Beg End (Depr. Exp.) Liabilities & Owners’ Equity (aka: “Re-Pete”) Accounts Payable Wages Payable $ 38,000 40,000 $ 37,000 Beg End $ - 0 - 45,000 10,000 30,000 $ 1,000 $ 41,000 Beg. (implied) DL IDL Admin Salaries End OUT $ 84,000 (from Cash) DM Purch (from Cash) Capital Stock R/E $ 160,000 $ 160,000 Beg End $ 49,000 18,320 $ 67,320 Beg End (Net Income)
Astoria Company (p. 3) Cannon Beach Sand Company Balance Sheet As of December 31, 2001 Assets Cash A/R Prepd Insur PPE Accum Depr RM WIP FG Total $ 34,820 23,000 3,000 219,000 (89,000) 11,000 21,500 42,000 $265,320 $ 37,000 1,000 160,000 67,320 $265,320 Liabilities & Owners’ Equity A/P W/P C/S R/E Total
Astoria Company (p. 4) Astoria Company Statement of Cash Flows (Indirect Method) For the Year-Ended December 31, 2001 Operating Activities Net Income Depr. Exp ↑ A/R (use) ↓ Prepd Ins (source) ↑ DM (use) ↑ WIP (use) ↑ FG (use) ↓ A/P (use) ↑ W/P (source) Net Cash provided by Operating Activities Purch of Equipment Net Cash used by Investing Activities Net increase in cash Beg. Cash End Cash • $ 18,320 • + 36,000 • - 5,000 • + 1,000 • - 2,000 • - 1,500 • - 10,000 • - 1,000 • + 1,000 • $ 36,820 • $ - 9,000 • $ (9,000) • $ 27,820 • 7,000 • $ 34,820 Calculation of Free Cash Flows Cash from Operations Less: Capital Expenditures (net) Free Cash Flows $36,820 9,000 $27,820 Investing Activities
Audio Basics Corporation ACTIVITY: “N” Number of production runs : $400,000 / 50 = $8000 per… “Q” Quality tests performed : $360,000 / 300 = $1200 per… “S” Shipping orders processed : $120,000 / 150 = $800 per… ----- ABC Standard High Grade 1. “N” “Q” “S” 40 × $8,000 = 180× $1,200 = 100 × $ 800 = $ 320,000 $ 216,000 $ 80,000 $ 616,000 $ 250,000 $ 348,000 $1,214,000 “N” “Q” “S” 10 × $8,000 = 120× $1,200 = 50 × $ 800 = $ 80,000 $ 144,000 $ 40,000 $ 264,000 $ 228,000 $ 132,000 $ 624,000 $ 616,000 + 264,000 $ 880,000 a. MOH DM DLTotal MFG MOH DM DLTotal MFG ÷ 320,000 units ÷ 100,000 units b. $3.79375 per unit $6.24 per unit 2. ----- Allocated MOH Est. MOH Activity $880,000 $480,000 = $1.833333 per DL$ Standard High Grade MOH DM DLTotal MFG $ 638,000 (= $348,000 × $1.833333) $ 250,000 $ 348,000 $1,214,000 MOH DM DLTotal MFG $ 242,000 (= $132,000 × $1.833333) $ 228,000 $ 132,000 $ 602,000 ÷ 320,000 units ÷ 100,000 units $3.8625 per unit $6.02 per unit
The Baize Company $403,200 Estimated MOH a. $19.20 per DLH = = PDOR = Estimated Activity 21,000 DLH Applied MOH = Actual Activity × PDOR b. $384,000 20,000 DLH × $19.20 = MOH c. $384,000 $378,000 $6,000 Overapplied $6,000 to COGS - 0 -
Ballycanally Corporation 1. DM Price Qty AQ × AC 14,000 × $1.80 $25,200 AQ × SC 14,000 × $1.75 $24,500 SQ × SC × $1.75 (6300)(2) $700 U AQ × SC 13,250 × $1.75 $23,187.50 SQ × SC 12,600 × $1.75 $22,050 $1137.50 U Rate Efficiency 2. DL SQ × SC (2000)(2) × $9.00 $36,000 AQ × AC 4,100 × $9.05 $37,105 AQ × SC 4,100 × $9.00 $36,900 $900 U $205 U
Ballycanally Corp. (p. 2) 3. Spending Efficiency VOH SQ × SC (Applied) 28,000 × $1.20 $33,600 AQ × AC 27,750 × $1.22 $33,855 AQ × SC 27,750 × $1.20 $33,300 $300 F $555 U $255 U 4. FOH Spending Volume Actual $155,500 Budget $144,000 Applied (SQ × SC) 60,000 × $2.50 $150,000 $6,000 F $11,500 U $5,500 U
Beale Street Blues, Inc. DM Price Usage SQ × SC AQ × AC 25,000 × $2.60 $65,000 AQ × SC 25,000 × $2.50 $62,500 (7800 units)(3lbs) $2,500 U SQ × SC 23,400 × $2.50 $58,500 AQ × SC 23,100 × $2.50 $57,750 1 DL $750 F 2 Efficiency Rate (7800 units)(5 hrs) AQ × AC 40,100 × $7.50 $300,750 AQ × AC 40,100 × $7.30 $292,730 SQ x SC 39,000 × $7.50 $292,500 $8020 F $8250 U 4 3 $230 U
Beale Street Blues (p. 2) VOH Efficiency Spending SQ × SC (7800)(5) 39,000 × $3.00 $117,000 Actual AQ × AC $130,000 AQ × SC 40,100 × $3.00 $120,300 $9,700 U $3,300U 5 FOH Volume Spending Applied SQ x SC (7800)(5) 39,000 × $4.00 $156,000 Actual AQ × AC $170,000 Budgeted BQ × SC 40,000 × $4.00 $160,000 $10,000 U $4,000 U 7 6
Bee-Cee’s Guitar Emp. (A) JAN FEB MAR Total JAN Dec. Jan. Jan. Feb. Feb. Mar. $100,000×20% $ 60,000×80% $ 60,000×20% $ 80,000×80% $ 80,000×20% $ 90,000×80% $20,000 48,000 $68,000 FEB $12,000 64,000 $76,000 $16,000 72,000 $88,000 MAR $232,000
Bee-Cee’s Guitar Emp. (B) JAN FEB MAR Total JAN Dec. Jan. Jan. Feb. Feb. Mar. $70,000×90% $42,000×10% $42,000×90% $56,000×10% $56,000×90% $63,000×10% $63,000 4,200 $67,200 FEB $37,800 5,600 $43,400 $50,400 6,300 $56,700 MAR $167,300
Bee-Go Company FG – Feb. FG – Apr. FG – Jan. FG – Mar. 16,500 15,650 1,650 1,650 16,450 1,600 1,600 16,250 1,850 15,600 16,500 16,000 18,500 (10%×16,500) (10%×16,000) (10%×18,500) Units Produced Jan. Feb. Mar. Total 15,650 16,450 16,250 48,350
Bee-Kill Chemical (A) RM – Q2 RM – Q4 RM – Q1 (2007) RM – Q1 RM – Q3 45,000 189,400 50,400 50,400 177,600 60,000 60,000 186,800 46,800 46,800 166,800 57,600 57,600 (46,000×4 lbs.) (42,000×4 lbs.) (50,000×4 lbs.) (48,000×4 lbs.) (39,000×4 lbs.) 184,000 168,000 200,000 156,000 192,000 (30%×168,000) (30%×184,000) (30%×156,000) (30%×192,000) RM Purchased Q1 Q2 Q3 Q4 189,400 177,600 186,800 166,800 720,600 Total pounds of raw materials purchased Cost per pound of raw material × $4 $2,882,400 Total cost of raw materials purchased
Bee-Kill Chemical (B) 2006 Units DLH Quarter 1 Quarter 2 Quarter 3 Quarter 4 46,000 42,00050,000 48,000 115,000 105,000125,000 97,500 442,500 Q1 Q2 Q3 Q4 × 2.5 DLH per unit = DLH worked during 2006 × $20 DL cost per hour Cost of DLH worked during 2006 $8,850,000
Bee-Kill Chemical (C) Production Information Variable Costs Fixed Costs per Quarter Quarter 1, 2006 Quarter 2 Quarter 3 Quarter 4 Total 46,000 42,000 50,000 39,000 177,000 Units Units Units Units Units Indirect material Indirect labor Utilities Total $2.25 1.50 1.00 $4.75 Per unit Per unit Per unit Per unit Supervisor salaries Factory depreciation Other Total $80,000 30,000 4,100 $114,100 1. Variable MOH by Qtr. $218,500 199,500 237,500 185,250 $840,750 Quarter 1, 2006 Quarter 2 Quarter 3 Quarter 4 Total ( = 46,000 units × $4.75)( = 42,000 units × $4.75)( = 50,000 units × $4.75)( = 39,000 units × $4.75) 2. Total MOH for 2006 Variable costs Fixed costs Total mfg. overhead $ 840,750 456,400 $1,297,150 ( = $114,100 × 4 Qtrs.)
Bee-Safe Company 2004 2005 First quarter Second quarter Third quarter Fourth quarter 21,000 26,00025,000 30,000 27,300 33,80032,500 39,000 132,600 × 130% = Unit sales during 2005 × $40 Selling price per unit Sales revenue during 2005 $5,304,000
Belly Rub Productions BELLY RUB PRODUCTIONS Unit Product Cost Data Years 2001 through 2004 Year 2001 2002 2003 2004 Variable manufacturing costs: Direct materials………………………….. $ 6 $ 6 $ 7 $ 8 Direct labor……………………………… 3 4 4 5 Variable MOH…………………………… 2 2 3 4 Product cost using variable costing………… $11 $12 $14 $17 Add prorated fixed MOH cost……………… 5 6 7 8 Product cost using absorption costing……… $16 $18 $21 $25 BELLY RUB MANUFACTURING Absorption Costing Income Statement For Years 2001 through 2004 Year 2001 2002 2003 2004 Sales………………………………… $200,000 $243,000 $390,000 $350,000 Cost of goods sold………………….. 128,000 158,000 258,000 242,000 Underapplied (overapplied) overhead 0 (12,000) 0 16,000 Gross margin………………………. 72,000 97,000 132,000 92,000 Variable selling and administrative... 24,000 27,000 52,000 50,000 Fixed selling and administrative…… 30,000 35,000 40,000 50,000 Total operating expenses…………… 54,000 62,000 92,000 100,000 Net income………………………… $18,000 $35,000 $40,000 $ (8,000)
Belly Rub Productions (p. 2) BELLY RUB MANUFACTURING Variable Costing Income Statement For Years 2001 through 2004 Year 2001 2002 2003 2004 Sales ……………………………………….. $200,000 $243,000 $390,000 $350,000 Variable product cost ……………………. 88,000 106,000 172,000 164,000 Manufacturing contribution margin ……….. 112,000 137,000 218,000 186,000 Variable selling and administrative ……….. 24,000 27,000 52,000 50,000 Contribution margin ……………….………. 88,000 110,000 166,000 136,000 Fixed manufacturing overhead ……………. 50,000 60,000 70,000 80,000 Fixed selling and administrative…………… 30,000 35,000 40,000 50,000 Total fixed cost …………………………… 80,000 95,000 110,000 130,000 Net income ……………………………….. $ 8,000 $ 15,000 $ 56,000 $ 6,000 Belly Rub Productions Schedule of Product Costs with Absorption Costing Years 2001 through 2004 Belly Rub Productions Schedule of Product Costs using Variable Costing Years 2001 through 2004 Total Product Cost $128,000 $158,000 $258,000 $242,000 Total Product Cost $ 88,000 $106,000 $172,000 $164,000 Beginning Inventory - 0 - 2,000 units @ $16 5,000 units @ $18 2,000 units @ $21 Beginning Inventory - 0 - 2,000 units @ $11 5,000 units @ $12 2,000 units @ $14 Current Year Production 8,000 units @ $16 7,000 units @ $18 8,000 units @ $21 8,000 units @ $25 Current Year Production 8,000 units @ $11 7,000 units @ $12 8,000 units @ $14 8,000 units @ $17 Year 2001 2002 2003 2004 Year 2001 2002 2003 2004 + + + + + + + +
Belly Rub Productions (p. 3) BELLY RUB PRODUCTIONS Schedule of Fixed Overhead Costs Included In Beginning and Ending Inventory Under Absorption Costing Year 2001 2002 2003 2004 Units in beginning inventory … Applied fixed MOH per unit … Equals ………………………. Units in ending inventory …… Fixed MOH per unit …………. Equals ………………………. Causes absorption costing NI to be ………………………… - 0 - 2,000 $ 5 $10,000 $10,000 Higher 2,000 $ 5 $10,000 5,000 $ 6 $30,000 $20,000 Higher 5,000 $ 6 $30,000 2,000 $ 7 $14,000 $16,000 Lower 2,000 $ 7 $14,000 - 0 - $14,000 Lower
Benton Company N/A Spend Eff. VOH SQ × SC AQ × AC $25,150 SQ × SC (310) (9) × $8 $22,320 AQ × SC 3,010 × $8 $24,080 $1,760 U $1,070 U N/A Vol. Spend N/A FOH Budget BQ × SC 2,700 × $9 $24,300 Actual $23,800 Budget $24,300 Applied SQ × SC (310) (9) × $9.00 $25,110 N/A $500 F $810 F Vol. Spend Eff. TOTAL $48,950 $47,430 $1760 U $570 U $810 F $1520 U $20,769 / $6.90 = 3010 DLH 310 units actual x 9 hrs. = 2790 hrs. $63 / 9 hrs. = $7 / hr. = DL cost per hr. $45,900 $8 + $9 = 2,700 budgeted DL hrs.
B.G. Wip Company Step 1 WIP DM CC 100% 60% 100% 1/3 2,000 9,000 3,300 7,700 Weighted Average Method FIFO Method Step 2 Step 2 Wtd. Avg. Equivalent Units FIFO Equivalent Units DM CC 7,700 7,700 3,300 1,100 11,000 8,800 DM CC - 0 - 800 5,700 5,700 3,300 1,100 9,000 7,600 OUT EI 3300 × 100% 3300 × 1/3 E.U. BI 2,000 × 0% 2,000 × 40% S&F EI 3300 × 100% 3300 × 1/3 E.U.
Big Dog Foods Standard Allowed for Actual Output pounds Price Quantity / Usage AQ × AC AQ × SC SQ × SC 24,500 × $0.20 $4,900 (30)(800) × $0.20 24,000 × $0.20 $4,800 24,500 × $0.19 $4,655 $245 F $100 U $145 F DIRECT MATERIALS – Ground Brown Rice
Big Dog Foods (p. 2) Standard Allowed for Actual Output pounds Price Quantity / Usage AQ × AC AQ × SC SQ × SC 5,900 × $0.40 $2,360 (30)(200) × $0.40 6,000 × $0.40 $2,400 5,900 × $0.41 $2,419 $59 U $40 F $19 U DIRECT MATERIALS – Chicken Meal
Big Dog Foods (p. 3) Standard Allowed for Actual Output DLH Rate Efficiency AQ × AC AQ × SC SQ × SC 300 × $15.00 $4,500 (30)(8) × $15.00 240 × $15.00 $3,600 300 × $16.00 $4,800 $300 U $900 U $1,200 U DIRECT LABOR
Bob’s Beef Boy DM WIP FG 0 Meat $54,000 Lettuce $6,750 Tomatoes $7,500 Kaiser rolls $9,250 0 0 $77,500 66,400 66,350 0 0 $210,250 0 $210,250 COGM $210,250 $77,500 DL COGS $210,250 0 $210,250 $66,400 $66,400 MOH I/S Condiments $2,650 Paper $2,400 Utilities $22,500 Grill Depr. $7,000 Rent $25,000 Cleaning $6,800 $66,350 $210,250 Servers $53,000 Mgr. $41,000 Depr. Signs $3,250 Adv. $3,500 $311,000 $478,800 $167,800 $66,350
Bojangle Dance Shoes Absorption Costing Income Statement For the Year Ended Dec. 31, 2002 Rev. $630,000 COGS: Prime (252,000) V.MOH (84,000) F.MOH (100,000) GM $194,000 S&A: V.Sell (54,000) F.Sell (45,000) F.Adm (90,000) NI $5,000 Variable Costing Income Statement For the Year Ended Dec. 31, 2002 Rev. $630,000 VC: Prime (252,000) V.MOH (84,000) V.Sell (54,000) CM $240,000 FC: F.MOH (100,000) F.Sell (45,000) F.Adm (90,000) NI $5,000
Bowly Company • Bowly Company • Variable Costing I/S • For the Y/E Dec. 31, 2005 • Rev • VC • CM • - FC • NI • Bowly Company • Absorption Costing I/S • For the Y/E Dec. 31, 2005 • Rev • CoGS • GM • - S&A • NI $100,000 (50,000) $ 50,000 (30,000) (10,000) $ 10,000 = 5,000 × $20 = 5,000 × $10 MOH S&A $100,000 (60,000) $ 40,000 (15,000) (10,000) $ 15,000 = 5,000 × $20 = 5,000 × $12 = 5,000 × $3 The difference in NI equals the change in FG Inventory times the fixed MOH per unit (1,000 × $5 = $5,000)
DIRECT MATERIALS Brötchen Bakery Standard Allowed for Actual Output Pounds Price Usage Qty purch = Qty used AQ × AC AQ × SC SQ × SC 30,000 × $2.20 $66,000 30,000 × $2.00 $60,000 (1,450)(20) × $2.00 $58,000 $6,000 U $2,000 U $8,000 U DIRECT LABOR DLH Rate Efficiency AQ × AC AQ × SC SQ × SC 8,000 × $18.90 $151,200 8,000 × $18.00 $144,000 (1,450)(5) × $18.00 $130,500 $7,200 U $13,500 U $20,700 U
VARIABLE OVERHEAD Brötchen Bakery (p. 2) DLH Spending Efficiency AQ × AC AQ × SC SQ × SC $150,000 ÷ 100,000 DLH 8,000 × $1.375 $11,000 8,000 × $1.50 $12,000 (1,450)(5) × $1.50 $10,875 $1,000 F $1,125 U Standard Allowed for Actual Output SQ = $125 U $300,000 ÷ 100,000 DLH FIXED OVERHEAD DLH Spending Volume Actual Budgeted AQ × SC Applied SQ × SC 8,000 × $3.25 $26,000 8,333.33 × $3.00 $25,000 (1,450)(5) × $3.00 $21,750 $1,000 U $3,250 U 100,000 DLH ÷ 12 months $4,250 U
Buffalo Broilers • PDOR = Est. MOH / Est. Activity • $500,000 / 100,000 DLH = $5.00 per DLH • $500,000 / $800,000 = $0.625 per DL$ • $500,000 / 80,000 MH = $6.25 per MH 1.
Buffalo Broilers (cont.) MOH (DLH) Actual Applied $5.00 * 120,000 $576,000 = $600,000 $24,000 overapplied 2. MOH (DL$) Actual Applied .625 * $930,000 $576,000 = $581,250 $5250 overapplied MOH (MH) Actual Applied $6.25 * 90,000 $576,000 = $562,500 $13,500 underapplied 3. $576,000 / 120,000 DLH = $4.80 Actual MOH per Actual DLH