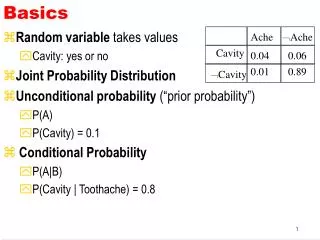
STEREONET BASICS
STEREONET BASICS. Pages 692-704 (The figures in this section of your text are especially important). Stereonets. Stereonets are used for plotting and analyzing 3-D orientations of lines and planes in 2-D space

STEREONET BASICS
E N D
Presentation Transcript
STEREONET BASICS Pages 692-704 (The figures in this section of your text are especially important)
Stereonets • Stereonets are used for plotting and analyzing 3-D orientations of lines and planes in 2-D space • It is MUCH more convenient than using Cartesian space (x-y-z coordinates) for graphically representing and analyzing 3-D data
Stereonets: Why bother? Stereonets are used in: • Landslide hazard/slope failure studies • Earthquake studies • Fracture analyses used in hydrogeology and/or groundwater pollution potentials • Mining industry (fossil fuels included) • Engineering • Practically anything that deals with relative orientations of planes and lines
Mysteries of Stereographic projection (691-694) • Any line or plane can be assumed to pass through the center of a reference sphere • Planes intersect the lower hemisphere as GREAT CIRCLES • Lines intersect the lower hemisphere as POINTS • The great circles or points are projected on the horizontal plane to create STEREOGRAPHIC PROJECTIONS or stereograms
Small circles (Look like LATITUDES) Great circles (Look like LONGITUDES)
Mysteries of Stereographic projection (691-694) • The horizontal plane or the plane of reference (the EQUATORIAL PLANE, Page 692) is represented by the outer circle of the stereogram • A vertical plane shows up as a straight line on the stereogram • Inclined planes (0<dip angle<90º) are represented by projections of the great circles (show up as curved lines)
Dip angles Equatorial circle = horizontal plane Straight lines = vertical planes 40 0 20 20 60 60 0 80 80 40 Great circles = inclined planes
Mysteries of Stereographic projection (691-694) • The projection of a gently dipping plane (dip angle <45º) will be more curved than that of a steeply dipping plane (dip angle > 45º) • A line is represented as a point on the stereogram • A horizontal line will project as a point on the equatorial plane • Vertical line???
Small circles = Paths of inclined lines around the N-S axis N 20 40 60 80 W E S
Lines and planes are plotted as stereograms by combining the great and the small circles on the stereonets
Plotting the orientation of a line using a stereonet (694-697)Lab 2
Plotting a plane by its dip and dip direction on a stereonet (also known as DIP VECTOR) • Dip = inclination of the line of greatest slope on an inclined plane • Refers to TRUE DIP as opposed to APPARENT DIP of a plane • 0 ≤ apparent dip <true dip • Dip direction is ALWAYS perpendicular to strike direction • The dip and dip direction of an inclined plane completely defines its attitude • Plotted the same way as lines
Defining a plane by its POLE (page 698) • POLE of a plane = line perpendicular to the plane • A plane can have ONLY ONE pole • The orientation of the pole of a plane completely defines the orientation of the plane • This is the MOST common way planes are represented on a stereogram
Plotting the pole of a plane (page 698) • If you have strike/dip/dip direction data, Start the same way you normally would for plotting the great circle for the plane • Identify the dip line (the line of greatest slope) on the great circle *** • The POLE is the line perpendicular to the dip line • To get to the pole of the plane, count 90 from the dip line along the E-W vertical plane, and mark the point ***You don’t need to draw the great circle
Measuring the angle between two lines Angle between two lines is measured on the plane containing both lines • Plot the points representing the lines • Rotate your tracing paper so both points lie on the same great circle. This great circle represents the plane containing both lines • Count the small circles between those two points along the great circle to determine the angle between the lines.
Measuring the angle between two planes • Angle between two planes is the same as the angle between their poles (this is yet another reason for plotting poles instead of great circles for planes) • Plot the poles for the planes • Rotate your tracing paper so both poles lie on the same great circle. • Count the small circles between those two poles along the great circle to determine the angle between the two planes.
Measuring angle between two planes on stereonet (lab 3) Measure the angles between the pairs of planes with the given attitudes • Strike • 342 • S27W • N35W • 278 • 132 • N25E Dip/dip direction 38NE 43SE 57SW 23N 65SW 71NW Pair #1 Pair #2 Pair #3
Plotting a plane using trend and plunge (or apparent dip/dip direction) data of two lines lying on that plane • Plot the points representing the lines • Rotate your tracing paper so those two points lie on the same great circle • Trace and label that great circle
Plotting a plane from trend/plunge data of two lines (lab 3) Identify the plane containing the following pairs of lines with the given attitudes • Trend • 357.5 • 112.5 • 17.5 • 282.5 • 77.5 • 330.5 Plunge 67 26 58 59 90 58 Pair #1 Pair #2 Pair #3