Download
1 / 63
630 likes | 807 Vues
1. Modeling the Effects of Land Use and Global Change on Ecosystem Services ~ Overview of EPA Western Ecology Division Models ~ Presentation for NCEA Global Change Research Program March 18, 2008 – Corvallis, Oregon Bob McKane, Research Ecologist mckane.bob epa.gov 541-754-4631. @.

E N D
1 Modeling the Effects of Land Use and Global Change on Ecosystem Services ~ Overview of EPA Western Ecology Division Models ~ Presentation for NCEA Global Change Research Program March 18, 2008 – Corvallis, Oregon Bob McKane, Research Ecologist mckane.bob epa.gov 541-754-4631 @ Office of Research and Development National Health and Environmental Effects Research Laboratory, Western Ecology Division, Corvallis, Oregon
2 Abstract
5 snobear.colorado.edu/IntroHydro/hydro.gif Hydrologic Processes within Landscapes
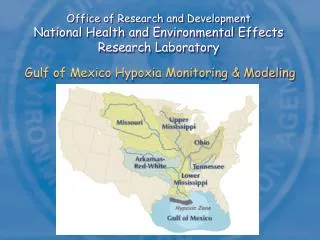
Flint Hills Demo Kansas Ecoregions Konza LTER * Kansas City * Flint Hills 10,000 mi2 Kilometers
8 USGS Stream Gauge USGS Stream Gauge Kings Creek Watershed, Konza Prairie (11 km2) SSURGO soil map, superimposed on orthophoto
9 GT Hydrologic Model Simulation, Flint Hills Ecoregion, Kansas Stream network (right) DEM (left) Kings Creek Watershed, 11 km2 100 km2 Precip record Discharge at
Dynamic simulations of stream discharge & soil moisture distribution 10 Soil Moisture DriestWettest DEM (left) Soil Moisture (right)
Dynamic simulations of stream discharge & soil moisture distribution 11 Soil Moisture DriestWettest
MODES: a MODular Ecosystem Services model for assessing human impacts on land, air & water resources Bob McKane, Project Coordinator (EPA-WED) Marc Stieglitz & Feifei Pan (Georgia Institute of Technology) Ed Rastetter & Bonnie Kwiatkowski (Marine Biological Laboratory) Nathan Schumaker (EPA-WED), Brad McRae (NCEA), Allen Solomon (USFS), Richard Busing (USGS) Water Quality & Quantity Agricultural Ecosystem Services Wildlife Populations Forest Ecosystem Services Air Quality & Greenhouse Gases Habitat Quality
Greenhouse Gases Forest Products Ag Products Wildlife Human Well-Being Water Quality & Quantity • The Problem: • Human actions affect multiple ecosystem services • No single model can capture all stressor effects & ES trade-offs Aquatic Life
Multi-Model Approach MODES Models Wildlife Populations Plant Communities Biogeochemistry Hydrology Stressors Effects
Stressors • Land Use • Urban • Agriculture • Forestry • Global Change • Climate • CO2 • N deposition • Chemicals • Fertilizers • Pesticides • Toxics • Terrestrial Services • Ag products • Forest products • C sequestration • Nutrient regulation • GHG regulation • Wildlife Aquatic Services • Drinking water • Flood mitigation • Aquatic life Multi-Model Approach MODES Models Wildlife Populations Plant Communities Biogeochemistry Hydrology Stressors Effects
16 MODES
MODES Philosophy Modular: different models for different suites of eco services Process-Based: link effects to stressors (GCC, land use…) Simple: few parameters & drivers Broad Applicability: ag, forest, grassland, tundra… Flexible Scales: plots watersheds, days centuries Regulatory & Planning Goals Best Management Practices: balancing multiple eco services Water Quality: nutrients, contaminants Water Quantity: too little, too much Greenhouse gases: CO2, N2O, NOx… Habitat & Wildlife: effects of land use & toxics
MODES suite of models Climate: *PRISM – high resolution climate data *SNOPACK – snow accumulation, drifting & melt SOILTEMP – soil temperature & permafrost freeze/thaw Hydrology: *GT –spatially distributed land surface hydrology Stream Network– streamflow accumulation & nutrient attenuation Biogeochemistry: *MEL – C, N, P, H2O cycling in plants & soils *PSM – plant & soil C & N, losses of DIN, DON *NESIS – stable isotope simulator Wildlife Habitat & Populations *FORCLIM – plant community / habitat dynamics *PATCH – wildlife population dynamics *Developed or modified through EPA-WED
Climate: *PRISM – Daly, Smith, Smith & McKane 2007, J. Applied Meteorology & Climatology *SNOPACK – Stieglitz 1994, Journal of Climate *SOIL-TEMP – Stieglitz, Ducharne, Koster & Suarez 2001, J. Hydrometeorology Hydrology: *GT –Pan et al. in prep; McKane et al., in review Stream Network – Liu & Weller 2007, Environmental Modeling & Assessment Biogeochemistry: *MEL – Rastetter, Perakis, Shaver & Agren 2005, Ecological Applications *PSM – Stieglitz, McKane & Klausmeier 2006, Global Biogeochemical Cycles *NESIS – Rastetter , Kwiatkowski & McKane 2005, Ecological Applications Wildlife Habitat & Population Dynamics *FORCLIM – Busing, Solomon, McKane, Burdick 2007, Ecological Applications *PATCH – McRae, Schumaker, McKane, Busing, Solomon, Burdick, Ecol. Mod. in press Recent Publications
MODES Climate
High Resolution Climate Data South Santiam Watershed, 500 km2 Climate Stations for PRISM Calibration PRISM Climate Model Daly, Smith, Smith & McKane 2007
Tmax(RAD adjusted) Tmax Tmin RAIN SNOW RAD • PRISM Climate Data: • Daily time-step • 1-hectare grid Feb. 17, 2003 Tmax Tmax(RAD adjusted) Tmin RAIN SNOW RAD June 19, 2003 PRISM Climate Model Daly, Smith, Smith & McKane 2007
Observed Simulated Snowpack Accumulation & Melt Sleepers River Watershed, VT Winter 1970 - 1971 SNOWPACK Snow Dynamics Snow Depth (cm) Dec-70 Jan-71 Feb-71 Mar-71 Apr-71 M. Stieglitz 1994
SNOPACK Snow Dynamics Snow Accumulation & Drifting in Complex Terrain Wind direction M. Stielglitz Wind direction
Simulated Permafrost Region Observed Permafrost Boundary Observed Discontinuous Permafrost Boundary SOIL-TEMP Soil Thermodynamics SOIL TEMPERATURE MODEL Stieglitz, Ducharne, Koster & Suarez 2001
MODES Hydrology
GT Hydrology Georgia Tech (GT) Hydrology Model Spatially Distributed Hydrologic Processes snobear.colorado.edu/IntroHydro/hydro.gif
P ET1 Qs D1 s1 Q1 ET2 s2 Q2 D2 Q3 s3 D3 s4 Q4 Bedrock GT Hydrology GT is relatively simple 3 “free” parameters vs. dozens for some hydrology models (e.g., HSPF) S = storage P = precipitation D = drainage (infiltration) Q = runoff ET = evapotranspiration Pan, Stieglitz & McKane in prep
Climate Station GT Hydrology A Forest Application: HJ Andrews Western Oregon Cascades Photo: Al Levno
Climate Station GT Hydrology A Forest Application: HJ Andrews Western Oregon Cascades • Effects of harvest, fire and climate change on: • stream water quality and quantity • forest productivity • carbon sequestration Photo: Al Levno
Stream Discharge (mm/d) 1997 1996 1998 1999 2000 2001 Stream Discharge (mm/d) 32 GT Hydrology
Plants Soils Plants Soils But, we need to move nutrients with water Topographic control of H2O, C, N, P cycling H2O NH4, NO3, PO4 DON, DOC H2O NH4, NO3, PO4 DON, DOC, Stream
MODES Biogeochemistry
MEL: Multiple Element Limitation Model Rastetter et al., 2005, Ecological Applications 15(1) Vegetation Soil N Leaching Denitrification • Simulates acclimation of plants & microbes to changing resources • Resources: H2O, PO4, NH4, NO3, DON, N fixation, CO2, light • Effects of climate, land use, & chemicals • Daily to century-scale responses • Simulates grasslands, forests, tundra, agricultural systems, wetlands...
GT-MEL Eco-Hydrology
39 GT-MEL Eco-Hydrology Carbon g/m2 Phase II C g/m2 HJ Andrews WS-10 Accumulation of C, N & P during forest succession Nitrogen g/m2 Phase II N g/m2 Phosphorus g/m2 Phase II P g/m2 YEARS Ed Rastetter Clearcut, Burn
GT-MEL Eco-Hydrology Climate Change Effects on C Sequestration Old-Growth Forest, HJ Andrews WS-10 Woody Debris Net Sequestration after 10 yr (g C / m2) Combined 80% ppt +4oC 2x CO2 Ed Rastetter 40
GT-MEL Eco-Hydrology An Agricultural Application Crop Production & Water Quality Trade-offs H2O NO3, NH4, DON Nassauer
GT-MEL Eco-Hydrology Day Ammonium fertilizer added to corn field on day 150 McKane, Kwiatkowski, Stieglitz, Pan, Rastetter in review 42
GT-MEL Eco-Hydrology 43 Trade-off: Corn Yield vs. Water Quality McKane, Kwiatkowski, Stieglitz, Pan, Rastetter in review
GT-MEL Eco-Hydrology • Where did all the fertilizer N go? • What processes were most important for protecting water quality?
GT-MEL Eco-Hydrology 20-yr Cumulative N Inputs & Losses kg N / ha (35% less N leaching) kg N / ha McKane, Kwiatkowski, Stieglitz, Pan, Rastetter in review
To atmosphere NO3- N2O N2 Denitrification Requires: • Nitrate • Low soil O2 • Labile carbon GT-MEL Eco-Hydrology
47 Willamette Valley Agricultural Validation Sites for GT-MEL Chesapeake WS109 Peterjohn & Correll 1984
MODES Stable Isotope SimulatorTracing H2O & Nutrients within Organisms, Communities & Landscapes Rastetter, Kwiatkowski & McKane 2005
MODES Stream Network Model Downstream Flow Accumulation & Nutrient Attenuation Liu & Weller 2007
Stream Network Model Stream Network Model Streamflow Accumulation & Nutrient Attenuation Liu & Weller 2007