Download
1 / 51
520 likes | 882 Vues
The Liquefaction Resistance and Maximum Shear Modulus of Frozen Samples. Yao-Chung Chen Department of Construction Engineering National Taiwan University of Science and Technology Taipei, Taiwan Pu-Shang You Department of Civil Engineering De-Lin Institute of Technology Taipei, Taiwan.

E N D
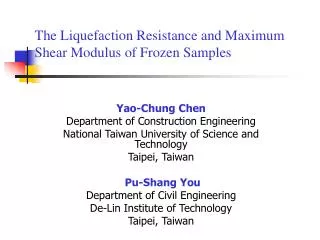
The Liquefaction Resistance and Maximum Shear Modulus of Frozen Samples Yao-Chung Chen Department of Construction Engineering National Taiwan University of Science and Technology Taipei, Taiwan Pu-Shang You Department of Civil Engineering De-Lin Institute of Technology Taipei, Taiwan
INTRDUCTION • The 1999 Chi-Chi earthquake caused a lot of liquefaction damages in western Taiwan. Our National Science Council sponsored a 3-year integrated research to study the liquefaction. • We are in charge of carrying out in-situ freezing and sampling to recover high quality soil samples and to investigate their dynamic properties.
INTRDUCTION(CONT.) • The liquefaction resistance and maximum shear modulus of frozen samples were obtained by performing cyclic triaxial tests and resonant column tests, respectively. • The laboratory testing results were compared with the in-situ testing results.
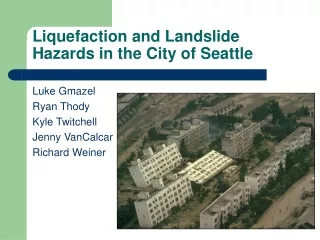
FREEZING AND SAMPLING • Descriptions of Test Site • The town of Yuanlin is selected as the test site for the research. • It was subject to some of the most severe liquefaction observed from the 1999 earthquake.
Descriptions of Test Site • Soil conditions in the relatively flat portions of Yuanlin generally consist of Holocene alluvium to depths of 50-60 m overlying older sedimentary deposits. • Groundwater occurs at depths between 0.5-7 m.
Descriptions of Test Site • The test site had sand boils at the surface and tilting buildings. • Preliminary investigation shows that the ground condition consists of inter-layered silty sands and silty clays.
Descriptions of Test Site • The zone between depths 10 to 15m consists mostly of sandy soils; therefore, it is selected as the target zone of freezing and sampling.
Geometry of Freezing and Sampling System • In-situ freezing was carried out by using liquid nitrogen flowing through four freeze pipes which were arranged in a square pattern with 80 cm spacing. • Four sample boreholes were advanced and cased to the depth of 9.5m prior to the freezing process.
Freezing Process Fig. 2 Changes of ground temperatures with time.
Freezing Process • only No. 1 and No. 2 showed rapid decrease of ground temperatures and the ground became frozen after two days. • sample holes S-3 and S-4 probably did not reach ground frozen condition . it was decided to carry out sampling work from sample holes S-1 and S-2.
Freezing Process • Coring of in-situ frozen samples was undertaken utilizing continuous coring technique with NX core barrel. Core runs were 1m in length. • The frozen samples were transported to the laboratory in a refrigerator at -20℃.
CYCLIC TRIAXIAL TEST RESULTS AND ANALYSES • Physical Properties of Frozen Samples • Frozen samples obtained from borehole S-2 were trimmed for cyclic triaxial testing. A total of nine samples were trimmed.
Table 1 Physical properties of frozen samples for cyclic triaxial tests
Fig. 3 Particle size distribution curves of frozen samples for cyclic triaxial tests
Liquefaction Resistance of frozen samples • Undrained cyclic triaxial tests were performed in a cyclic triaxial test apparatus. • All samples were consolidated at 98.1kPa effective confining pressures before they were subjected to undrained cyclic loading.
Liquefaction Resistance of frozen samples • The liquefaction resistance is defined as the cyclic stress ratio required causing soil to reach initial liquefaction at a certain number of cyclic loading.
Table 2 Summaries of liquefaction test results of frozen samples
Liquefaction Resistance of remolded samples • Two types of remolded samples with fines contents equal to 16% and 55% were prepared by both dry tamping (DT) and moist tamping (MT) methods. • The samples were consolidated at 98.1kPa effective confining pressures before they were subjected to undrained cyclic triaxial loading tests.
Liquefaction Resistance of remolded samples • The remolded specimens were prepared and consolidated to have dry densities equal to 1.40 and 1.60 g/cm3 for CL samples, and 1.40 g/cm3 for SM samples.
Fig. 5 Liquefaction test results of CL remolded samples (γd=1.40g/cm3) with comparison of the results of frozen samples.
Fig. 6 Liquefaction test results of CL remolded samples (γd=1.60g/cm3) with comparison of the results of frozen samples.
Fig. 7 Liquefaction test results of SM remolded samples (γd=1.40g/cm3) with comparison of the results of frozen sample.
RESONANT COLUMN TEST RESULTS AND ANALYSES • Physical Properties of Frozen Samples • Ten frozen samples were trimmed for resonant column testing, two from borehole S-2 and eight from borehole S-1. • The dry densities are in the range of 1.19 to 1.46 g/cm3.
Physical Properties of Frozen Samples • Three out of ten samples have fines contents less than 50%, and are classified as SM or SC. The other seven samples have fines content 60~90%. • According to the fines content, the samples can be grouped in to three categories as 20%, 40~60%, and 80~90% of fines content.
Table 3 Physical properties of frozen samples for resonant column tests
Fig. 8 Particle size distribution curves of frozen samples for resonant column tests
Maximum Shear Modulus of Frozen Samples • The frozen samples were first consolidated at 100kPa effective confining pressures and their resonant frequencies were measured, then the confining pressures were increased at 50kPa increment up to 300kPa and resonant frequencies were measured at each stress interval.
COMPARISONS WITH IN-SITU TEST RESULTS • In-situ SPT Test Results • Three boreholes were drilled and standard penetration tests (SPT) were performed at each 1.5m interval. • Three types of hammers (safety, automatic, and donut) were used and the driving energies were measured.
In-situ SPT Test Results • The subsoil conditions for Boreholes No. 1 and No. 2 are alternate layers of CL and SM. The subsoil conditions for Borehole No. 3 are mostly SM. The energy ratio is the highest for safety hammer (about 70~85), the second for automatic hammer (about 60~80), and the lowest for donut hammer (about 55~75).
Liquefaction Resistance Estimated by SPT-N • The simplified procedure based on SPT-N1 as suggested by 1996 NCEER workshop was used to evaluate the seismic liquefaction potential of the in-situ soils. • The cyclic stress ratio (CSR) and the cyclic resistance ratio (CRR) were calculated.
calculation of CSR Seed and Idriss formulated the following equation for calculation of CSR
Sandy soils containing some fines • Studies in China suggest that the potential for cyclic liquefaction in silts and clays is controlled by grain size, liquid limit, and water content. When a soil satisfies the following three criteria, the soil might experience liquefaction problem.
Three criteria • Percent finer than 0.005mm ≤15% (4a) • Liquid limit ≤35% (4b) • Water content >0.9 × liquid limit (4c)
Liquefaction of CL • According to the results of Table 1 and Fig. 3, the CL frozen samples have clay content (<0.005mm) in the range of 17~40%, liquid limit 27%, and nature water content in the range of 30~40%. The CL samples satisfy only the criteria of Eqs. 4b and 4c, however, the high content of clay particles might prohibit the soil to liquefy.
Comparison Between Laboratory and In-Situ Tests • According to the tendency curves in Fig. 4, the cyclic stress ratios of the frozen samples at 15 cycles (correspondent to M=7.5 earthquake) can be estimated. • To be consistent with in-situ anisotropic stress conditions, the CRR obtained from laboratory tests on the frozen samples should be converted .
converted equation: σ´o : the isotropic effective confining stress used in the laboratory tests. Ko : the at rest lateral stress coefficient.
Fig. 10 Comparison of the CRR obtained from laboratory tests on CL frozen samples with in-situ SPT tests of Borehole No.1.
Fig. 11 Comparison of the CRR obtained from laboratory tests on CL frozen samples with in-situ SPT tests of Borehole No.2.
Fig. 12 Comparison of the CRR obtained from laboratory tests on SM frozen sample with in-situ SPT tests of Borehole No.3.
Comparisons of Maximum Shear Modulus with Shear Wave Velocities • Three CPT tests (boreholes YLA, YLB, and YLC) were performed with measurements of shear wave velocities at the test site. • The maximum shear modulus of the frozen samples was converted to shear wave velocity.
Fig. 13 Comparisons of the laboratory results with in-situ shear wave velocities
CONCLUSIONS • Fines content influences a lot the ground freezing efficiency. The ground freezing efficiency is very poor for clayey soils and very good for sandy soils. • In-situ frozen samples have much higher liquefaction resistance than remolded samples.
CONCLUSIONS (Cont.) • The liquefaction resistance of CL frozen samples is smaller than the one predicted from SPT-N1. This indicates that clayey soils experienced certain degree of disturbance during freezing process.
CONCLUSIONS (Cont.) • The liquefaction resistance of SM frozen sample is about the same as the one predicted from SPT-N1. This indicates that the disturbance was quite small during freezing and sampling process.
CONCLUSIONS (Cont.) • According to the laboratory testing on frozen sample and the in-situ SPT tests, the sandy soils (SM) of the test site would liquefy during the Chi-Chi Earthquake which is consistent with the phenomena of sand boils observed at the test site.