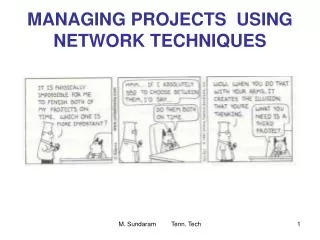
MANAGING PROJECTS USING NETWORK TECHNIQUES
MANAGING PROJECTS USING NETWORK TECHNIQUES. Project Management. Project Management is one of the world’s most in-demand skill sets and is one of the fastest growing professional disciplines in North America.

MANAGING PROJECTS USING NETWORK TECHNIQUES
E N D
Presentation Transcript
MANAGING PROJECTS USING NETWORK TECHNIQUES M. Sundaram Tenn. Tech
Project Management • Project Management is one of the world’s most in-demand skill sets and is one of the fastest growing professional disciplines in North America. • Project Management is used by large corporations, governments, and smaller organizations to standardize and reduce the tasks necessary to complete a project in the most effective and efficient manner. • Engineers that master in project management skills may lead improvement initiatives that result in measurable growth in return on investment, economic value added, sales growth, customer satisfaction and retention, market share, time to market, employee satisfaction, and employee motivation. • PMI provides certification in project management M. Sundaram Tenn. Tech
Network based Techniques-Outline • Project Planning – An Introduction • Development of Project Network • Identifying Critical paths • Probabilistic Analysis in PERT Networks • How to use the Normal table • Project Cost Control • Resource Allocation • EVA for monitoring progress of Projects M. Sundaram Tenn. Tech
PERT and CPM • PERT (Program Evaluation Review Technique) was developed by a joint team set up by the U.S. Navy Special Projects Office that included representatives from Lockheed Aircraft Corporation (Prime contractor of the POLARIS program) and from the consulting company Booze, Allen, and Hamilton. • The objective of this team was to develop an integrated planning and control system for the Polaris missile submarine program which would help avoid the time and cost overruns that had plagued other such development programs. • An important feature of the PERT approach is its statistical treatment of the uncertainty in activity time estimate which involved the collection of three separate time estimates and the calculation of probability estimates of meeting specified schedule dates. • The three estimates used are: Optimistic time, Pessimistic time, and Most likely time. • PERT networks are usually to manage projects that have several uncertain activities M. Sundaram Tenn. Tech
PERT and CPM- Contd. • CPM (Critical Path Method) evolved from a parallel joint effort initiated originally at DuPont and later expanded to include Remington Rand Univac and Mauchly Associates. • The two key differences of this approach from PERT: (1) the use of only one time estimate for each activity (and thus no statistical treatment of uncertainty) and (2) the inclusion, as an integral part of the overall scheme, of a procedure for time/cost tradeoff to minimize the sum of direct and indirect project costs. • An important common feature of both PERT and CPM is the use of a network diagram for project representation in which arrows represent activities ("activity-onarrow"). • A modification of this approach involves the representation of activities by circles, with arrows indicating precedence ("activity-on-node"). M. Sundaram Tenn. Tech
Applications of PERT and CPM • Construction projects (e.g.) buildings, highways, houses, and bridges.) • Preparation of bids and proposals for large projects. • Maintenance planning of oil refineries, ships, chemical plants and other large scale operations. • Planning for relocating a facility • Manufacture and assembly of large and complex products such as airplanes, ships, and mainframe computers. • Simple projects such as home remodeling, moving to a new house, and home cleaning and painting. • Design and development of new products • Facilities planning and implementation of new layouts in manufacturing. • Development of computer Software packages M. Sundaram Tenn. Tech
Design Project – Unique sequence of activities (work tasks) required to be performed in developing a product. cost time Design project performance What is a design project? Changing the length of any side of the project triangle affects the other sides! M. Sundaram Tenn. Tech
1 2 3 Design Fabricate Project Planning A Simple Project Network M. Sundaram Tenn. Tech
? Managing a design project? Design problem –FUNCTION (customer & company requirements) Activities (decision making processes) Develop a project plan then execute the plan Solution - FORM (manufacturing specifications) M. Sundaram Tenn. Tech
Why should we plan a design project? In planning a design project we make decisions which answer the following questions WHAT ? ……...scope of work tasks WHEN ? ……...schedule HOW MUCH?..budget WHO?………...organization chart, responsibilities table Without a clear roadmap, how will you get where you need to go? M. Sundaram Tenn. Tech
Work breakdown structure M. Sundaram Tenn. Tech
Table 3.4 Example scope of work for section 1. Scope of work (partial) • 1.0 Design Problem Formulation • 1.1 Visit Site, • Meet with customers, determine desired attributes and parameters • 1.2 Complete QFD/HOQ • Determine requirements, engineering characteristics • 1.3 Satisfaction Curves, • Determine the satisfaction curves for each engineering characteristic. • 1.4 Create EDS • List in-use purposes for the product • List product performance requirements • 1.5 Conduct Benchmarking • Research existing products that are currently available • Contact manufacturers and request brochures • Analyze the competition for functionality and performance M. Sundaram Tenn. Tech 1.0 Design Problem Formulation 1.1 Visit Site, Meet with customers to determine desired attributes and parameters 1.2 Complete QFD/HOQ Determine requirements, engineering characteristics 1.3 Satisfaction Curves, Determine the satisfaction curves for each engineering characteristic. 1.4 Create EDS List in-use purposes for the product List product performance requirements 1.5 Conduct Benchmarking Research existing products that are currently available Contact manufacturers and request brochures Analyze the competition for functionality and performance 1.6 Contact Customers Make phone calls to determine pros and cons of current unit Set an appointment time to witness existing product operation 1.7 Determine parameters State problem definition parameters State design variables State solution evaluation parameters for satisfaction curves 1.8 Determine Schedule Refine work breakdown structure Assign a time value to each task Prepare Gantt chart 1.9 Calculate Budget Determine total number of engineering hours Determine total number of expert faculty hours Sum all hours and material cost 1.10 Outline Work Scope 1.11 Prepare for and conduct design review meeting.
Responsibilities table assist Who does what responsible M. Sundaram Tenn. Tech
Project schedule M. Sundaram Tenn. Tech
Project Budget M. Sundaram Tenn. Tech
Elements of Project Management • Project team • Individuals from different departments within company • Matrix organization • Team structure with members from different functional areas depending on skills needed • Project manager • Leader of project team M. Sundaram Tenn. Tech
Project Planning • Statement of work • Written description of goals, work & time frame of project • Activities require labor, resources & time • Precedence relationship shows sequential relationship of project activities M. Sundaram Tenn. Tech
Project Control • All activities identified and included • Completed in proper sequence • Resource needs identified • Schedule adjusted • Maintain schedule and budget • Complete on time M. Sundaram Tenn. Tech
A Gantt Chart • Popular tool for project scheduling • Graph with bar for representing the time for each task • Provides visual display of project schedule • Also shows slack for activities • Amount of time activity can be delayed without delaying project M. Sundaram Tenn. Tech
Month 0 2 4 6 8 10 | | | | | Activity Design house and obtain financing Lay foundation Order and receive materials Build house Select paint Select carpet Finish work 1 3 5 7 9 Month A Gantt Chart M. Sundaram Tenn. Tech Figure 6.2
CPM/PERT- A Little History • Critical Path Method (CPM) • DuPont & Remington-Rand (1956) • Deterministic task times • Activity-on-node network construction • Project Eval. & Review Technique (PERT) • US Navy, Booz, Allen & Hamilton • Multiple task time estimates • Activity-on-arrow network construction M. Sundaram Tenn. Tech
Node 1 2 3 Arc The Project Network Network consists of arcs & nodes Figure 6.3 M. Sundaram Tenn. Tech
Network Construction • In AON, nodes represent activities & arrows show precedence relationships • In AOA, arrows represent activities & nodes are events for points in time • An event is the completion or beginning of an activity • A dummy shows precedence for two activities with same start & end nodes M. Sundaram Tenn. Tech
3 Lay foundation Dummy Build house Finish work 2 0 3 1 1 2 4 6 7 3 1 Design house and obtain financing Order and receive materials 1 1 Select paint Select carpet 5 Project Network for a House Figure 6.4 M. Sundaram Tenn. Tech
3 Lay foundation Lay foundation Dummy 2 3 2 0 2 4 1 Order material Order material (a) Incorrect precedence relationship (b) Correct precedence relationship Concurrent Activities M. Sundaram Tenn. Tech
Example Problem -1 Develop an activity-on-arrow (AOA) type network for the precedence relationship shown below. M. Sundaram Tenn. Tech
Solution M. Sundaram Tenn. Tech
Example Problem -2 Develop an A-O-A type network from the description below. M. Sundaram Tenn. Tech
Solution M. Sundaram Tenn. Tech
Critical Path • A path is a sequence of connected activities running from start to end node in network • The critical path is the path with the longest duration in the network • Project cannot be completed in less than the time of the critical path M. Sundaram Tenn. Tech
Lay foundation Dummy Build house Finish work 2 0 3 1 3 1 Design house and obtain financing Order and receive materials 1 1 Select paint Select carpet 3 1 2 4 6 7 5 The Critical Path A: 1-2-3-4-6-73 + 2 + 0 + 3 + 1 = 9 months B: 1-2-3-4-5-6-73 + 2 + 0 + 1 + 1 + 1 = 8 months C: 1-2-4-6-73 + 1 + 3 + 1 = 8 months D: 1-2-4-5-6-73 + 1 + 1 + 1 + 1 = 7 months M. Sundaram Tenn. Tech
Lay foundation Dummy Build house Finish work 2 0 3 1 3 1 Design house and obtain financing Order and receive materials 1 1 Select paint Select carpet 3 1 2 4 6 7 5 The Critical Path A: 1-2-3-4-6-7 3 + 2 + 0 + 3 + 1 = 9 months B: 1-2-3-4-5-6-7 3 + 2 + 0 + 1 + 1 + 1 = 8 months C: 1-2-4-6-7 3 + 1 + 3 + 1 = 8 months D: 1-2-4-5-6-7 3 + 1 + 1 + 1 + 1 = 7 months The Critical Path M. Sundaram Tenn. Tech
Lay foundation Dummy Build house Finish work 2 0 3 1 3 1 Design house and obtain financing Order and receive materials 1 1 Select paint Select carpet 3 3 Finish at 9 months Start at 5 months 2 0 1 3 1 1 2 4 6 7 1 2 4 6 7 3 1 1 Start at 8 months Start at 3 months 5 5 The Critical Path Activity Start Times M. Sundaram Tenn. Tech
Lay foundation Dummy Build house Finish work 2 0 3 1 3 1 Design house and obtain financing Order and receive materials 1 1 Select paint Select carpet 3 1 2 4 6 7 2003 5 Early Times • ES - earliest time activity can start • Forward pass starts at beginning of CPM/PERT network to determine ES times • EF = ES + activity time • ESij=maximum (EFi) • EFij=ESij- tij • ES12=0 • EF12 =ES12+ t12=0 + 3 = 3months M. Sundaram Tenn. Tech
Lay foundation Dummy Build house Finish work 2 0 3 1 3 1 Design house and obtain financing Order and receive materials 1 1 Select paint Select carpet 3 1 2 4 6 7 5 Computing Early Times • ES23 = max EF2 = 3 months • ES46 = max EF4 = max 5,4 = 5 months • EF46 = ES46 + t46 = 5 + 3 = 8 months • EF67 = 9 months, the project duration M. Sundaram Tenn. Tech
Lay foundation Dummy Build house Finish work 2 0 3 1 3 1 Design house and obtain financing Order and receive materials 1 1 Select paint Select carpet Early Start and Finish Times 3 3 (ES = 3, EF = 5) (ES = 5, EF = 5) 2 0 (ES = 5, EF = 8) 1 2 4 6 7 1 3 1 1 2 4 6 7 3 (ES = 0, EF = 3) (ES = 3, EF = 4) (ES = 8, EF = 9) 1 1 (ES = 5, EF = 6) (ES = 6, EF = 7) 5 5 Computing Early Times M. Sundaram Tenn. Tech
Late Times • LS - latest time activity can start & not delay project • Backward pass starts at end of CPM/PERT network to determine LS times • LF = LS + activity time • LSij=LFij-tij • LFij= minimum (LSj) M. Sundaram Tenn. Tech
Lay foundation Dummy Build house Finish work 2 0 3 1 3 1 Design house and obtain financing Order and receive materials 1 1 Select paint Select carpet 3 1 2 4 6 7 5 Computing Late Times • LF67 = 9 months • LS67 = LF67 - t67 = 9 - 1 = 8 months • LF56 = minimum (LS6) = 8 months • LS56 = LF56 - t56 = 8 - 1 = 7 months • LF24 = minimum (LS4) = min(5, 6) = 5 months • LS24 = LF24 - t24 = 5 - 1 = 4 months M. Sundaram Tenn. Tech
Lay foundation Dummy Build house Finish work 2 0 3 1 3 1 Design house and obtain financing Order and receive materials 1 1 Select paint Select carpet 3 1 2 4 6 7 5 Computing Late Times • LF67 = 9 months • LS67 = LF67 - t67 = 9 - 1 = 8 months • LF56 = minimum (LS6) = 8 months • LS56 = LF56 - t56 = 8 - 1 = 7 months • LF24 = minimum (LS4) = min(5, 6) = 5 months • LS24 = LF24 - t24 = 5 - 1 = 4 months M. Sundaram Tenn. Tech
Early and Late Start and Finish Times 3 ( ) ( ) ES = 3, EF = 5 LS = 3, LF = 5 ES = 5, EF = 5 LS = 5, LF = 5 ( ) ES = 5, EF = 8 LS = 5, LF = 8 2 0 1 3 1 1 2 4 6 7 3 ( ) ( ) ( ) ES = 0, EF = 3 LS = 0, LF = 3 ES = 3, EF = 4 LS = 4, LF = 5 ES = 8, EF = 9 LS = 8, LF = 9 1 1 ( ) ( ) 5 ES = 5, EF = 6 LS = 6, LF = 7 ES = 6, EF = 7 LS =7, LF = 8 M. Sundaram Tenn. Tech
Activity Slack • Activities on critical path have ES = LS & EF = LF • Activities not on critical path have slack • Sij = LSij - ESij • Sij = LFij - EFij • S24 = LS24 - ES24 = 4 - 3 = 1 month M. Sundaram Tenn. Tech
Lay foundation Dummy Build house Finish work 2 0 3 1 3 1 Design house and obtain financing Order and receive materials 1 1 Select paint Select carpet 3 Activity LS ES LF EF Slack *1-2 0 0 3 3 0 *2-3 3 3 5 5 0 2-4 4 3 5 4 1 *3-4 5 5 5 5 0 4-5 6 5 7 6 1 *4-6 5 5 8 8 0 5-6 7 6 8 7 1 *6-7 8 8 9 9 0 * Critical path 1 2 4 6 7 5 Activity Slack Data M. Sundaram Tenn. Tech
Lay foundation Dummy Build house Finish work 2 0 3 1 3 1 Design house and obtain financing Order and receive materials 1 1 Select paint Select carpet 3 3 Activity Slack Activity LS ES LF EF Slacks *1-2 0 0 3 3 0 *2-3 3 3 5 5 0 2-4 4 3 5 4 1 *3-4 5 5 5 5 0 4-5 6 5 7 6 1 *4-6 5 5 8 8 0 5-6 7 6 8 7 1 *6-7 8 8 9 9 0 * Critical path S = 0 S = 0 1 2 4 6 7 1 2 4 6 7 2 0 S = 0 1 3 1 S = 0 S = 1 S = 0 3 5 5 1 1 S = 1 S = 1 Activity Slack Data M. Sundaram Tenn. Tech
Other Methods of Determining the Critical Path • Simple Method • Tabular Method • Enumeration of all paths M. Sundaram Tenn. Tech
Simple Method M. Sundaram Tenn. Tech
Enumeration of all paths M. Sundaram Tenn. Tech
Probabilistic Time Estimates • Reflect uncertainty of activity times • Beta distribution is used in PERT M. Sundaram Tenn. Tech
a + 4m + b 6 Mean (expected time): t = 2 b - a 6 Variance: 2 = where a = optimistic estimate m = most likely time estimate b= pessimistic time estimate Probabilistic Time Estimates • Reflect uncertainty of activity times • Beta distribution is used in PERT M. Sundaram Tenn. Tech
P(time) P(time) a m t b a t m b Time Time P(time) a m = t b Time Example Beta Distributions M. Sundaram Tenn. Tech
d 2 6 Equipment testing and modification Equipment installation Final debugging a e Dummy l System development f i m 1 3 5 7 9 b Manual Testing System Training System changeover Position recruiting Job training System Testing c g j k Dummy h 4 8 Orientation Kat Tech Company M. Sundaram Tenn. Tech