Download
1 / 43
440 likes | 619 Vues
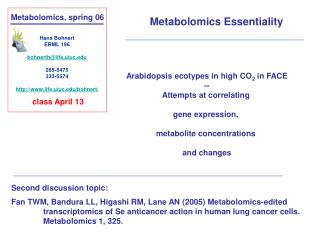
Hans Bohnert ERML 196 bohnerth@life.uiuc.edu 265-5475 333-5574 http://www.life.uiuc.edu/bohnert/. Metabolomics, spring 06. Metabolomics Essentiality. Arabidopsis ecotypes in high CO 2 in FACE -- Attempts at correlating gene expression, metabolite concentrations and changes.

E N D
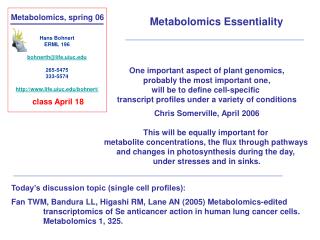
Hans Bohnert ERML 196 bohnerth@life.uiuc.edu 265-5475 333-5574 http://www.life.uiuc.edu/bohnert/ Metabolomics, spring 06 Metabolomics Essentiality Arabidopsis ecotypes in high CO2 in FACE -- Attempts at correlating gene expression, metabolite concentrations and changes class April 13 Second discussion topic: Fan TWM, Bandura LL, Higashi RM, Lane AN (2005) Metabolomics-edited transcriptomics of Se anticancer action in human lung cancer cells. Metabolomics 1, 325.
I am expanding the “FACE” discussion based on two papers on stochastic events in gene expression and single cell protein synthesis Blake WJ, Kaern M, Cantor ER, Collins JJ (2003) Noise in eukaryotic gene expression. Nature 422, 633. Cai L, Friedman N, Xie XS (2006) Stochastic protein expression in individual cells at the single molecule level. Nature 440, 358.
How to measure protein synthesis in single cells Single reporter molecule sensitivity on a microfluidic device
Quantitative real-time measurements of individual protein expression events in E. coli
Steady-state protein copy number distributions in a population of cells
Arabidopsis in the field? No further comment! • Ambient • high CO2 • high O3 • [CO2 + O3] SoyFACE Starting early to mid June http://www.soyface.uiuc.edu temperature difference between ambient and high CO2 in SoyFACE. ‘You are mad!’
Microarray materials: all experiments used collections of more then 10 plants (entire above- ground material) for each hybridization sample! High ozone ring #7 - ecotype: Cape Verde; least affected by ozone or CO2
Phenotypically WS turned out the most ‘sensitive’ ecotype under all conditions! Ozone ring, R7- WS; growing next to ecotype CapeVerde; shot taken the same day; most affected by elevated CO2/O3
typical example mature rosette Col, control ring
Col 21 Cvi 21 Cvi 27 Col 27 Supplemental Figure 1(SF1).
Col 21 Col 27 Cvi 21 Cvi27 Cluster 1 Cluster 2 Cluster 3 Cluster 4 Cluster 5 Cluster 6 90 54 171 4 29 133 Microarrays 3 rings ambient and 3 rings high CO2 hybridizations (3/sample, dye-swap) normalization statistical analysis - R, SAS fuzzy k-means clustering cluster centroids metabolites from same material – rosette leaves Ecotypes Col - Columbia Cvi - Cape Verde Island Figure 4.
HSPs GSTs Col 21 Cvi 21 Col27 Cvi 27 Supplemental Figure 2 (SF2). HSPs/GSTs
-0.6 0 0.6 (log 2 fold change) Light reactions Photorespiration Calvin cycle Col 21 Cvi 21 Col27 Cvi 27 Photosynthesis functions down-regulated Cvi recovers over time Figure 5A.
Cell wall precursor synthesis Cellulose synthesis Hemicellulose synthesis Cell wall Proteins AGPs Cell wall proteins LRR Cell wall, HRGP Cell wall, RGP Col 21 Cvi 21 Col27 Cvi 27 Col grows faster in CO2 Figure 5B.
Ct & Mt ribosomal proteins 40S ribosomal proteins 60S ribosomal proteins putative ribosomal proteins Col 21 Cvi 21 Col27 Cvi 27 Transient down-regulation of translation functions Figure 5C.
Col Jun 27 Cvi Jun 27 Col Jun 21 Cvi Jun 21 Supplemental Figure 3C. RNA metabolism/ protein synthesis
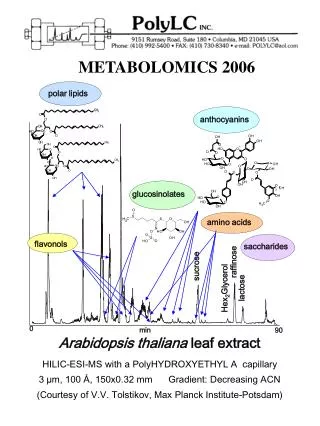
Metabolites Col 21 CO2/ P- ambient value fold change glutamic acid 0.39 0.00 threonine 0.61 0.11 Total 0.56 0.02 citric acid 0.73 0.05 malic acid 0.77 0.10 p-hydroxybenzoic acid 0.55 0.09 Total 0.86 0.07 maltose 1.55 0.09 trehalose 0.80 0.31 Total 1.08 0.53 mannitol 1.33 0.11 glycerol 0.87 0.23 inositol 0.96 0.84 Total 0.97 0.74 glucose-6-P 0.55 0.10 phosphate 0.71 0.24 Absolute change and Confidence Amino acids Organic acids Sugars In total ~60 metabolites could be scored Alcohols
June 27 6 carbon sugars 12 carbon sugars Organic acid Sugars 18 carbon sugars Metabolite changes (major categories) over time points June 21 Amino acid Polyols Col-0 Cvi-0 Figure 6.
Transcripts -0.6 0 0.6 (log2 - fold change) Metabolites Galactinol 2.4.1.123 Galactose Raffinose 2.4.1.82 Starch Sucrose 3.2.1.1 Neutral Invertase 3.2.1.26 Invertase, cell wall 3.2.1.2 Invertase, vacuole 2.4.1.25 MEX1 Cysteine Fructose Maltose Glucose Melibiose Cvi 27 Col 21 Col 27 Cvi 21 DEP2 4.2.99.8 5.3.1.9 Tryptophan isoforms 2.7.1.1 2.3.1.30 4.1.1.48 1.2.1.12 5.3.1.24 2.7.2.3 2.1.2.1 3.1.3.3 2.6.1.52 1.1.1.95 2.4.2.18 Serine Glycine 3-Phosphoglycerate 5.4.2.1 4.1.3.27 2.6.1.42 1.1.1.85 4.2.1.33 4.1.3.12 4.2.1.11 Leucine Phenylalanine 4.1.1.49 PEP 4.2.3.4 2.7.1.40 4.2.1.10 4.1.1.31 2.6.1.5 2.6.1.42 Valine 1.1.1.86 2.2.1.6 Pyruvate 2.7.1.71 Oxaloacetate Asparagine 4.2.1.51 2.5.1.19 Acetyl-CoA 4.2.3.5 6.3.5.4 5.4.99.5 Chorismate Prephenate 4. 1.3.8 Aspartate 2.6.1.1 Oxaloacetate 2.3.3.1 1.3.1.12 Citrate 2.7.2.4 Tyrosine 1.1.99.16 1.2.1.11 4.2.1.3 Aspartate-4-semialdehyde Malate Isocitrate 1.1.1.3 Proline 4.2.1.52 2.7.1.39 1.3.1.26 1.1.1.42 Homoserine-4-phosphate 4.2.1.2 At5g14800 At5g62530 2.6.1.17 1.4.7.1 4.2.99 alpha-Ketoglutarate Glutamate Fumarate 3.5.1.18 4.4.1.8 4.2.3.1 AT5G65750 5.1.1.7 6.3.1.2 Threonine 1.3.5.1 6.2.1.4 2.1.1.14 Succinate Glutamine Lysine 2.2.1.6 2.1.1.10 Methionine Figure 7. 1.1.1.86 2.6.1.42 Isoleucine
Col June 21 Col June 27 -C -N -P -C -N -P Cvi June 21 Cvi June 27 Do Arabidopsis in high CO2 experience nitrogen deficit? Ecotype-specific reactions Adaptation Acclimation Evolutionary background? Figure 8.
Col Jun 21 Cell wall Col Jun 27 Cell wall Cvi Jun 21 Cell wall Cvi Jun 27 Cell wall Supplemental Figure 3B.
Absorption by nuclei [not electrons] of electromagnetic radiation (up to ~900 MHz) • Certain nuclei with spin and magnetic moment split energy levels in a field • The split is characteristic of the nucleus and the bonds in which it is involved • Continuous wave (CW) and pulsed (Fourier-transformed, FT) spectrometers • http://en.wikipedia.org/wiki/Nuclear_magnetic_resonance
Chemical shift is usually expressed in parts per million (ppm) by frequency, • because it is calculated from: • Sincethe numerator is usually in hertz, and the denominator in megahertz, • delta is expressed in ppm. • The detected frequencies (in Hz) for 1H, 13C, and 29Si nuclei are usually referenced • against TMS (tetramethylsilane), which is assigned the chemical shift of zero. • Other standard materials are used for setting the chemical shift for other nuclei. • The operating frequency of a magnet is calculate from the Larmor equation: • Flarmor = γ * B0, where B0 is the actual strength of the magnet • in units like teslas or gauss, and • γ is the gyromagnetic ratio ofthe nucleus being tested.
Fan, Bandura, Higashi & Lane (2005) Metabolomics 1, 325-339 Metabolomics-edited transcriptomics analysis of Se anticancer action in human lung cancer cells (META) Transcriptomic analysis is an essential tool for systems biology but it has been stymied by a lack of global understanding of genomic functions, resulting in the inability to link functionally disparate gene expression events. Using the anticancer agent selenite and human lung cancer A549 cells as a model system, we demonstrate that these difficulties can be overcome by a progressive approach which harnesses the emerging power of metabolomics for transcriptomic analysis. We have named the approach Metabolomics-edited transcriptomic analysis (META). The main analytical engine was 13C isotopomer profiling using a combination of multi-nuclear 2-D NMR and GC-MS techniques. Using 13C-glucose as a tracer, multiple disruptions to the central metabolic network in A549 cells induced by selenite were defined. META was then achieved by coupling the metabolic dysfunctions to altered gene expression profiles to: (1) provide new insights into the regulatory network underlying the metabolic dysfunctions; (2) enable the assembly of disparate gene expression events into functional pathways that was not feasible by transcriptomic analysis alone. This was illustrated in particular by the connection of mitochondrial dysfunctions to perturbed lipid metabolism via the AMP-AMPK pathway. Thus, META generated both extensive and highly specific working hypotheses for further validation, thereby accelerating the resolution of complex biological problems such as the anticancer mechanism of selenite. Key words (3-6) two-dimensional NMR; GC-tandem MS; 13C isotopomer profiling; selenite; lung adenocarcinoma A549 cells. Abbreviations 1H–13C HMBC: 1H–13C heteronuclear multiple bond correlation spectroscopy; 1H–13C HSQC: 1H–13C heteronuclear single quantum coherence spectroscopy; 2-D 1H TOCSY: two dimensional 1H total correlation spectroscopy; [U)13C]-glucose: uniformly 13C-labeled glucose; MSn: mass spectrometry to the nth dimension; MTBSTFA: N-methyl-N-[tert-butyldimethylsilyl]trifluoroacetamide; P-choline or PC: phosphorylcholine; PDA: photodiode array; TCA: trichloroacetic acid.
Knowledge: Se is an essential atom, high amounts affect (cancer) growth, Se in proteins is related to ROS homeostasis (somehow) Experiment: The addition of Se to lung cells affects growth – what is the basis? Use genomics platforms (transcript analysis), GC-MS & esp. NMR Hypothesis: gene expression is altered, and metabolite analysis can be correlated with transcript changes – can it, is the question! Approaches Microscopy, NMR, GC-MS, transcripts
Se interferes with the cytoskeleton and mitochondrial activity Selenite effects proliferating cells; Selenite-rich diets may have anti-cancer applications.
Se leads to degradation of DNA TUNEL assay?
* * High resolution 2D NMR spectra of control and Se-treated cells
Metabolites with chemical shift indicative of changes 12C/13C and 1H connectivity