Download
1 / 31
310 likes | 461 Vues
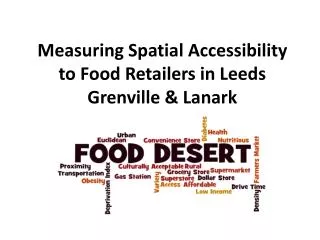
Measuring Spatial Accessibility to Food Retailers in Leeds Grenville & Lanark. Overview. Project assigned as part of dietetic internship student placement Was an opportunity to pilot the integration of GIS into some of our research/operations Was very much a descriptive study

E N D
Measuring Spatial Accessibility to Food Retailers in Leeds Grenville & Lanark
Overview • Project assigned as part of dietetic internship student placement • Was an opportunity to pilot the integration of GIS into some of our research/operations • Was very much a descriptive study • Was an opportunity to potentially geographically identify a priority population • Project focus was from a rural perspective
Dietetic Internship Project Goals • Primary goal: was to determine the existence of rural food deserts in areas of high deprivation in LGL • Use several network analysis techniques in GIS to assess primary goal • Use measures of deprivation to assess primary goal • Secondary goal: was to validate the precision & accuracy of our food retailer database
Dietetic Internship Project Goals Research Question: “Do residents of LGL with high levels of material, social, and overall deprivation have access within a 16km/20-minute drive time to a Food Retailer?”
What are Food Deserts • “Geographic area, particularly lower-income neighborhoods and communities, where access to affordable, quality and nutritious foods is limited” • “Socially deprived areas within cities that have poor access to food retailers” • “Socially distressed neighborhoods with relatively low average household incomes and poor access to healthy food”
Identifying Deprivation • Methodology developed by Pampalon & Raymond at INSPQ (Chronic Diseases in Canada, 2000) • Used 2006 Census data at DA level (400-700 persons) • Used education, employment, income, marital status, family structure, & persons living alone as indicators • Material = lack of access to modern goods and conveniences • Social = fragility of social networks • PCA to produce factor scores • Ranked DAs according to factor scores by population weighted quintile
A 58/42% rural/urban mix with population or approx. 163,000 persons spread over 22 CSD and 299 DA. (Stats Can, 2006) Who We Are
An urban area has a minimum population concentration of 1,000 persons and a population density of at least 400 persons per square kilometer, based on the current census population count. (Stats Can, 2006) Defining Urban & Rural
A FR was defined as any major grocery chain or independently owned grocery store as they sell a variety of healthy food products from the four food groups. This would exclude convenience stores, gas stations, etc. Buffered geography to avoid edge effect. Defining Food Retailers
The locational accuracy of the data was validated by comparing the positional data obtained from the PCCF (2010) to high resolution aerial ortho-photos (Digital Raster Acquisition Project East) Validating Locational Data
Methodology • Euclidean (buffered) method • Network (ORN) method
Euclidean Buffer Buffered Coverage
Road Networks Ontario Road Network
Road Networks Ontario Road Network
The 16 km Euclidean buffered technique tended to overstate the amount of retailer coverage compared to the 20 minute drive time analysis. Buffered vs. Road Networks
Overlays of the social deprivation and supermarket ORN layers were analyzed to determine if gaps in supermarket coverage correlated with areas of high deprivation. Mapping Social Deprivation
Overlays of the material deprivation and supermarket ORN layers were analyzed to determine if gaps in supermarket coverage correlated with areas of high deprivation. Mapping Material Deprivation
Now that food deserts have been identified we looked at the areas more carefully. Identifying Food Deserts
Now that food deserts have been identified we looked at the areas more carefully. Identifying Food Deserts
Conclusions • Rural food deserts do exist in LGL in terms of spatial and socioeconomic inequalities • The results suggest that efforts should be directed at strengthening the social networks that would facilitate access rather than the distribution of food retailers • Demonstrated the utility of GIS in giving research added perspective
Study Limitations • Assumes all individuals have vehicle access • Cut-offs (e.g.: 20 minutes/16km) • DA is a crude level of rural measurement • Incomplete food retailer database • Many variables affect access • Ecological study/aggregated data
Take Home Message • Exploratory study • Established baseline for measurement • Process is transferable/scalable • Further refinement necessary • More advanced co-relational statistical methodologies available
Thank you for your time • John.cunningham@healthunit.org • 613.345.5685 (2270)