Download
1 / 17

E N D
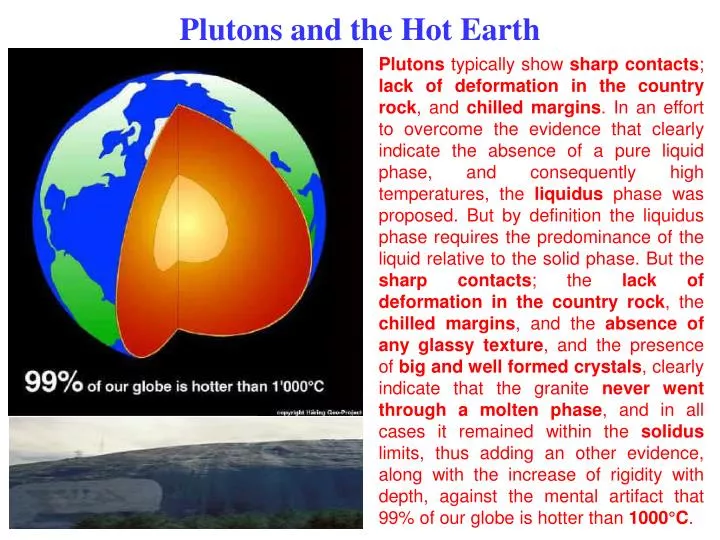
Plutons and the Hot Earth Plutons typically show sharp contacts; lack of deformation in the country rock, and chilled margins. In an effort to overcome the evidence that clearly indicate the absence of a pure liquid phase, and consequently high temperatures, the liquidus phase was proposed. But by definition the liquidus phase requires the predominance of the liquid relative to the solid phase. But the sharp contacts; the lack of deformation in the country rock, the chilled margins, and the absence of any glassy texture, and the presence of big and well formed crystals, clearly indicate that the granite never went through a molten phase, and in all cases it remained within the solidus limits, thus adding an other evidence, along with the increase of rigidity with depth, against the mental artifact that 99% of our globe is hotter than 1000°C.
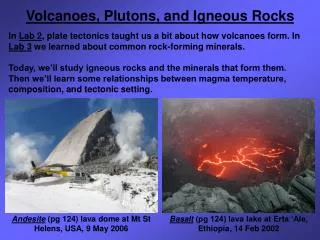
Velocity (km/sec) Temperature (K) Pressure (GPa) Unrealistic Conventional Temperature Profile Thevelocity of seismic waves is proportional to incompressibility, k, and rigidity, μ, and inversely proportional to density, ρ, as per VP [{k(4/3)μ}/ρ]1/2 and VS (μ/ρ)1/2. So, if it was only for density the velocity of seismic waves should decrease as density increases with depth. The only way we can have a velocity increase is for the elastic moduli to increase faster than density. This is impossible though if temperature increases with depth, because the elastic moduli are very sensitive to temperature they decrease by ~2% per degree of temperature increase, and are insensitive to static pressure increase, because the static stress is below the incompressibility and rigidity thresholds.
Batholith and Magma Formation a b Conventional View:About 50 m.y.a.magma, i.e.,melted, liquified rock, formed under the surface of Idaho. It pushed and shoved upward, creating many of the mountains of Idaho. Some magma squeezed up to the surface. Most of it stayed 30 to 70 km below the Earth's crust. Eventually, it cooled and hardened. The cooled rock is known today as the Idaho granitic batholith (a). EMST view:But, mantle rock cooling rates are ~500 C/109 years, thus the batholith temperature today could only be 2.50 C lower than 50 m.y.a !! So, if the batholith is solid today it had to be solid during its emplacement time; magma formation is an episodic and surface phenomenon, as in (b).
c a b Granites and Granite Plutons Granite samples (a) and (b), and Stone Mountain at the central part of the Piedmont physiographic province of Georgia. In conventional thinking about 230 m.y.a., the Stone Mountain magma cooled approximately 10 km below the land surface. Erosion by wind and water have exposed the Stone Mountain granite at the present land surface. The domed shape of Stone Mountain is the result of exfoliation(c). (Images & captions from the Earth Science World, Image Bank). But, a) the sharp contacts; b) the lack of deformation in the country rock; c) the chilled margins; d) the presence of big crystals, and e) the very low cooling rates of plutons, of the order of ~50°C per billion years, indicate that these rocks never went through a molten stage, because if they were molten at the time of their emplacement they will still be molten today, and the if cooled the glassy texture would be evident.
New Dome & Temperature at Mt St Helens, 2004 This animation begins viewing Mount St. Helens from the north and flies into the crater to view the 1980-1986 dome from an east-facing perspective. The temperature scale shows MASTER thermal infrared temperatures overlain onto the dome topography. It shows topographic and temperature changes that occurred during the first 20 days of the 2004 eruptive activity (Sept 24 through Oct 14, 2004). Shaded relief imagery from LIDAR data acquired throughout this period show the uplift and growth of the new dome. The high temperatures of ~330°Con the west flank of the new dome (S.T. Note: ~1% of the total surface area of the dome) correlate with the new eruptive center and fresh lava that first appeared at the surface on Oct 11 (Vaughan, R. G., S. J. Hook, M. S. Ramsey, V. J. Realmuto, and D. J. Schneider (2005), Monitoring eruptive activity at Mount St. Helens with TIR image data, Geophys. Res. Lett., 32).
April 4, 2006 April 4, 2006 New Dome & Temperature at Mt St Helens, 2006 The highest temperatures in the newly formed dome do not exceed 200°C.
Conventional Hot Plume Crustal Breakup Model The most popular hypothesis for continental breakup magmatism is the arrival of a hot mantle plume. The plume impact hypothesis is a theory that attributes anomalous mantle melting to thermal anomalies in convecting mantle. For the melting of such hotter-than-normal mantle, we can make various geophysical and geochemical predictions, which can be compared with observations to validate (or invalidate) the hypothesis. (Jun Korenaga, Yale University).
The Hot Plume Model Models for origin of Large Igneous Provinces. After Coffin and Eldholm (1994). As it can be seen the higher temperatures are expected at the central part of the area above the head of the plume, e.g., 3000C as compared to 1000C at the edges of the dispersed plume head, as in (B).
Mental Artifacts vs Observation • Therefore if the hot plume model is correct, then: • The heat flow values should be higher in the central thinned partof thearea above the plume, and • The seismic wavevelocity should be lower at the central thinned part of the area above the plume and higher at its thicker flanks. • But, observation shows exactly the opposite: • The heat flow values are not higher than “normal” at the central thinned part of the area above the plume, and • The seismic wave velocity is higher at the central thinned part of the area above the plume and lower at its thicker flanks.
Mantle Temperatures and “Hotspot” Volcanism Sedimentary Evidence for Moderate Mantle Temperature Anomalies Associated with Hotspot Volcanism Peter D. Clift Department of Geology and Petroleum Geology, School of Geosciences, Meston Building, King's College, University of Aberdeen, Aberdeen AB24 3UE, United Kingdom Abstract One of the characteristics of deep-rooted mantle plume models and their associated excess hotspot volcanism is the presence of anomalously hot asthenosphere underlying the lithospheric plates. The emplacement and dispersal of hot asthenosphere is predicted to cause faster subsidence of hotspot crust compared to that seen in normal oceanic crust. However, studies of the sedimentary cover from a range of seamounts, plateaus and ridges of various ages from all major ocean basins show either no or only moderate anomalous additional subsidence that can be linked to hot asthenosphere during hotspot magmatism. Assuming all the subsidence is caused by excess mantle heat, temperature anomalies rarely exceed 100°C and could be somewhat lower if dynamic flow or composition are important causes of buoyancy. In many cases subsidence is slower than for normal oceanic lithosphere, suggesting either colder than normal mantle temperatures, or more likely the emplacement of buoyant lithospheric root under the magmatic province at the time of its formation.
Uplift Is Not Thermally Driven The Superswell and Darwin Rise: Thermal no longer? Carol A. Stein1 & Seth Stein2 1Dept. Earth & Environmental Sciences, University of Illinois at Chicago, Chicago IL 60607-7059 USA, cstein@uic.edu 2Department of Geological Sciences, Northwestern University, Evanston, IL 60208, USA, seth@earth.northwestern.edu …McNutt & Fisher [1987] suggested that the shallow bathymetry resulted from the lithosphere in the area having the temperature structure of an anomalously thin 75-km thick thermal plate. McNutt & Judge [1990] further suggested that the weak flexural strengths, low surface wave velocities [Nishimura & Forsyth, 1985], and geochemical anomalies [Hart, 1984, 1988; Castillo, 1988] were consequences of the combined effects of a thin thermal plate and a deeper low-density plume. In this model, the lithosphere is thinned by enhanced heat flux from the mantle and low viscosity beneath the plate, such that the weak plate is easily penetrated by hot spot volcanism… However, the thinning models predict heat flow much higher than observed. In fact, heat flow in the Superswell is no higher than for comparable age lithosphere elsewhere [Stein & Abbott, 1991; Stein & Stein, 1993].
Heat Flow Is Not High at Hotspots Why is heat flow not high at hotspots? Carol A. Stein1 & Seth Stein2 1Dept. Earth & Environmental Sciences, University of Illinois at Chicago, Chicago IL 60607-7059 USA, cstein@uic.edu 2Department of Geological Sciences, Northwestern University, Evanston, IL 60208, USA, seth@earth.northwestern.edu A peculiar aspect of hotspots is that heat flow data provide no evidence for their being hotter than lithosphere of the same age elsewhere. Originally, the uplift at Hawaii and similar midplate hotspots was thought to reflect a hot plume causing heating to about 50 km of the surface [Crough, 1983; McNutt and Judge, 1990]. Such heating predicts heat flow significantly higher than from the usual cooling of oceanic lithosphere as it spreads away from the mid-ocean ridges where it formed. Although anomalously high heat flow was initially reported, subsequent analysis showed that most, if not all, of the apparent anomalies resulted from comparing data to thermal models that underestimated heat flow elsewhere…
Mantle Below Iceland Is Not Hot Iceland & the North Atlantic Igneous Province G. R. Foulger Dept. Geological Sciences, University of Durham, Durham DH1 3LE, U.K., g.r.foulger@durham.ac.uk Abstract It is almost universally assumed that Iceland is underlain by a hot plume rising from deep within the mantle. Nevertheless, this hypothesis is inconsistent with many first-order observations at Iceland, which is the best-studied ridge-centred hotspot on Earth. There is essentially no evidence for very high mantle temperatures, a time-progressive volcanic track, a seismic anomaly in the lower mantle, or radial symmetry in the pattern of geochemical anomalies on land. Iceland is basically a melting anomaly underlain by an upper-mantle seismic low-wave-speed anomaly. Temperatures are only moderately, if at all, elevated above normal mid-ocean ridge temperatures, the geochemistry is spatially and temporally heterogeneous and it differs only subtly from MORB…Iceland and the associated North Atlantic Igneous Province are explained as natural consequences of relatively shallow processes related to plate tectonics (...enhanced fertility inherited from ancient subducted slabs that still remain in the shallow mantle) This contrasts with the plume model, where they are explained by a process entirely independent of plate tectonics – a narrow diapiric upwelling driven by heating at the surface of a deep, hot body such as the Earth's core.
LIPs, P-Wave Velocity and Crustal Thickness A B C The seismic velocity of igneous crust is mainly controlled by its MgO content (Korenaga 2006). Hotter mantle produces a larger amount of melt, with increasing MgO content (because of a larger olivine component in the melt). Therefore there should be a positive correlation between crustal volume and crustal velocity, if thick igneous crust is produced by melting anomalously hot mantle. This is not observed on the Greenland margin part of the North Atlantic LIP (A) as the thermal plume predictions (red line) and observation (blue dots) of P-wave velocities (B and C) indicate. Clearly, something other than the melting of hot mantle is involved (Korenaga et al., 2000, 2002, 2006). Exactly the same is observed in the Siberian LIP (Ivanov, 2006).
c a b Granites and Granite Plutons Granite samples (a) and (b), and Stone Mountain at the central part of the Piedmont physiographic province of Georgia. In conventional thinking about 230 m.y.a., the Stone Mountain magma cooled approximately 10 km below the land surface. Erosion by wind and water have exposed the Stone Mountain granite at the present land surface. The domed shape of Stone Mountain is the result of exfoliation(c). (Images and captions from the Earth Science World, Image Bank). But, a) the presence of big crystals, b) the very low cooling rates of plutons, of the order of ~50°C per billion years, indicate that these rocks never went through a molten stage, because if they were molten at the time of their emplacement they will be molten today.
c a b Felsic Granite & Mafic Xenoliths and Dikes Granite has intruded and included the preexisting darker mafic rock (near Virginia's Mount Rogers), or the mafic younger rock intruded in a solid state, into the preexisting granite (a), as the basaltic dike, has intruded the Mount Desert Granite of Maine's Acadia National Park (b), or as the mafic intrusion, photographed in January of 2000, on Useful Island, Antarctica, again as the sharp contact, the chilled margins, and the lack of any deformation in the surrounding rock indicate (c)? (Images and captions from the Earth Science World, Image Bank). Let alone that in the magmatic origin of granite batholiths a reasonable answer to the question: how the immense amount of country rock was removed to make room for the batholith?, is still pending. The answer is evident in the context of EMST. The Earth is being stretched constantly, thus creating microcracks that are then filled with the “excess mass” that originates in the Earth’s core and rises to the surface in a solid state, and it is emplaced like a nail in the wood, thus and the sharp contact.
Temperature at 4 – 5 km Depth a b (a) In older areas of continents, such as much of North America east of the Rocky Mountains, heat flow is generally 40 to 60 mWm-2. This heat flow coupled with the thermal conductivity of rock in the upper 4 km of the crust yields subsurface temperatures of 90 to 1100 C at 4 km depth in the Eastern USA. Heat flow within the Basin and Range (west of the Rocky Mountains) is generally 70-90 mWm-2, and temperatures are generally greater than 1100 C at 4 km. There are large variations in the Western USA, with areas of heat flow greater than 100 mWm-2 and areas of generally lower heat flow such as the Cascade and Sierra Nevada Mountains and the West Coast. (Joel L. Renner, Idaho National Engineering and Environmental Laboratory, Idaho, USA). (b) Estimated temperature at a depth of 5km across Australia. In Central Australia are predicted to be >3000 C (ANU).