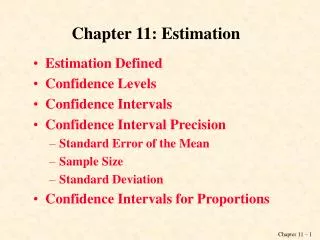
Estimation and Inference: Confidence Intervals for Population Parameters
Learn about point and interval estimation in statistical inference. Understand how to estimate unknown parameters with confidence intervals. Explore classical methods for estimating means in single-sample scenarios with known or unknown variances.

Estimation and Inference: Confidence Intervals for Population Parameters
E N D
Presentation Transcript
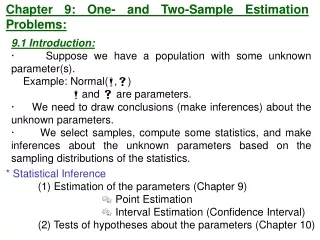
Chapter 9: One- and Two-Sample Estimation Problems: 9.1 Introduction: · Suppose we have a population with some unknown parameter(s). Example: Normal(,) and are parameters. · We need to draw conclusions (make inferences) about the unknown parameters. · We select samples, compute some statistics, and make inferences about the unknown parameters based on the sampling distributions of the statistics. * Statistical Inference (1) Estimation of the parameters (Chapter 9) Point Estimation Interval Estimation (Confidence Interval) (2) Tests of hypotheses about the parameters (Chapter 10)
9.3 Classical Methods of Estimation: Point Estimation: A point estimate of some population parameter is a single value of a statistic . For example, the value of the statistic computed from a sample of size n is a point estimate of the population mean . Interval Estimation (Confidence Interval = C.I.): An interval estimate of some population parameter is an interval of the form ( , ), i.e, << . This interval contains the true value of "with probability 1", that is P( << )=1 • ( , ) = << is called a (1)100% confidence interval (C.I.) • for . • 1 is called the confidence coefficient • = lower confidence limit • = upper confidence limit • =0.1, 0.05, 0.025, 0.01 (0<<1)
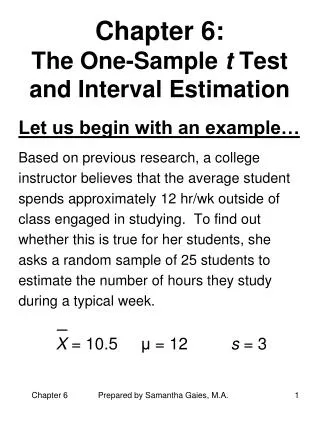
9.4 Single Sample: Estimation of the Mean (): Recall: (2 is known) (2 is unknown) We use the sampling distribution of to make inferences about .
Point Estimation of the Mean (): · The sample mean is a "good" point estimate for . Interval Estimation (Confidence Interval) of the Mean (): (i) First Case: 2 is known: Result: If is the sample mean of a random sample of size n from a population (distribution) with mean and known variance 2, then a (1)100% confidence interval for is : Notation: Za is the Z-value leaving an area of a to the right; i.e., P(Z>Za)=a or equivalently, P(Z<Za)=1a
where is the Z-value leaving an area of /2 to the right; i.e., P(Z> )=/2, or equivalently, P(Z< )=1/2. Note: We are (1)100% confident that
Solution: • = the mean zinc concentration in the river. PopulationSample =?? n=36 =0.3 =2.6 First, a point estimate for is =2.6. (a) We want to find 95% C.I. for . = ?? 95% = (1)100% 0. 95 = (1) =0.05 /2 = 0.025 Example 9.2: The average zinc concentration recorded from a sample of zinc measurements in 36 different locations is found to be 2.6 gram/milliliter. Find a 95% and 99% confidence interval (C.I.) for the mean zinc concentration in the river. Assume that the population standard deviation is 0.3.
= Z0.025 = 1.96 A 95% C.I. for is • 2.6 0.098 < < 2.6 + 0.098 2.502 < < 2.698 ( 2.502 , 2.698) We are 95% confident that ( 2.502 , 2.698).
Note: Error |-----------| ______|____________________________|____ |----------------------|--------------------------| Theorem 9.1: If is used as an estimate of , we can then be (1)100% confident that the error (in estimation) will not exceed (b) Similarly, we can find that (Homework) A 99% C.I. for is 2.471 < < 2.729 ( 2.471 , 2.729) We are 99% confident that ( 2.471 , 2.729) Notice that a 99% C.I. is wider that a 95% C.I..
Example: In Example 9.2, we are 95% confident that the sample mean differs from the true mean by an amount less than Note: Let e be the maximum amount of the error, that is , then: Theorem 9.2: If is used as an estimate of , we can then be (1)100% confident that the error (in estimation) will not exceed a specified amount e when the sample size is
Note: 1. All fractional values of are rounded up to the next whole number. 2. If is unknown, we could take a preliminary sample of size n30 to provide an estimate of . Then using as an approximation for in Theorem 9.2 we could determine approximately how many observations are needed to provide the desired degree of accuracy. Example 9.3: How large a sample is required in Example 9.2 if we want to be 95% confident that our estimate of is off by less than 0.05?
Solution: We have = 0.3 , , e=0.05. Then by Theorem 9.2, Therefore, we can be 95% confident that a random sample of size n=139 will provide an estimate differing from by an amount less than e=0.05. Interval Estimation (Confidence Interval) of the Mean (): (ii) Second Case: 2 is unknown: Recall:
Result: If and are the sample mean and the sample standard deviation of a random sample of size n from a normal population (distribution) with unknown variance 2, then a (1)100% confidence interval for is :
where is the t-value with =n1 degrees of freedom leaving an area of /2 to the right; i.e., P(T> )=/2, or equivalently, P(T< )=1/2. Solution: .n=7 First, a point estimate for is Example 9.4: The contents of 7 similar containers of sulfuric acid are 9.8, 10.2, 10.4, 9.8, 10.0, 10.2, and 9.6 liters. Find a 95% C.I. for the mean of all such containers, assuming an approximate normal distribution.
Now, we need to find a confidence interval for . = ?? 95%=(1)100% 0. 95=(1) =0.05 /2=0.025 = t0.025 =2.447 (with =n1=6 degrees of freedom) A 95% C.I. for is 10.0 0.262< < 10.0 + 0.262 9.74 < < 10.26 ( 9.74 , 10.26) We are 95% confident that ( 9.74 , 10.26).
9.5 Standard Error of a Point Estimate: · The standard error of an estimator is its standard deviation. · We use as a point estimator of , and we used the sampling distribution of to make a (1)100% C.I. for . · The standard deviation of , which is ,is called the standard error of . We write s.e. · Note: a (1)100% C.I. for , when 2 is known, is · Note: a (1)100% C.I. for , when 2 is unknown and the distribution is normal, is (=n1 df)
~N(0,1) 9.7 Two Samples: Estimating the Difference between Two Means (12): Recall: For two independent samples:
Point Estimation of 12: is a "good" point estimate for 12. Confidence Interval of 12: (i) First Case: and are known: Result: a (1)100% confidence interval for 12 is : or or
(ii) Second Case: = =2is unknown: If and are unknown but = =2, then the pooled estimate of 2 is where is the variance of the 1-st sample and is the variance of the 2-nd sample. The degrees of freedom of is =n1+n22. Result: a (1)100% confidence interval for 12 is : or
or or where is the t-value with =n1+n22 degrees of freedom.
Example 9.6:(1st Case: and are known) An experiment was conducted in which two types of engines, A and B, were compared. Gas mileage in miles per gallon was measured. 50 experiments were conducted using engine type A and 75 experiments were done for engine type B. The gasoline used and other conditions were held constant. The average gas mileage for engine A was 36 miles per gallon and the average for engine B was 42 miles per gallon. Find 96% confidence interval for BA, where A and B are population mean gas mileage for engines A and B, respectively. Assume that the population standard deviations are 6 and 8 for engines A and B, respectively.
Solution: Engine A Engine B nA=50 nB=75 =36 =42 A=6 B=8 A point estimate for BA is =4236=6. = ?? 96% = (1)100% 0. 96 = (1) =0.04 /2 = 0.02 = Z0.02 = 2.05 A 96% C.I. for BA is
3.43 < BA < 8.57 We are 96% confident that BA (3.43, 8.57). Example 9.7:(2nd Case: = unknown) Reading Assignment Example:(2nd Case: = unknown)
Solution: Wire A Wire B . nA=6 nB=6 S2A=7.86690 S2B=7.10009 ____________________________________ To compare the resistance of wire A with that of wire B, an experiment shows the following results based on two independent samples (original data multiplied by 1000): Wire A: 140, 138, 143, 142, 144, 137 Wire B: 135, 140, 136, 142, 138, 140 Assuming equal variances, find 95% confidence interval for AB, where A (B) is the mean resistance of wire A (B).
A point estimate for AB is =140.67138.50=2.17. 95% = (1)100% 0. 95 = (1) =0.05 /2 = 0.025 = df = nA+nB 2= 10 = t0.025 = 2.228 A 95% C.I. for AB is
or 1.35< AB < 5.69 We are 95% confident that AB (1.35, 5.69)