Download
1 / 25
250 likes | 279 Vues
This EIA study presents numerical modelling results for the Swakopmund Desalination Plant, assessing potential environmental impacts of brine disposal and sediment impacts. The study includes assessments based on assumed project descriptions, limitations, and uncertainties. Input data from NCEP waves and bathymetry were used for detailed wave, hydrodynamic, brine discharge, and sediment transport model results. Findings focus on the intake and discharge pipe layouts, diffuser length, and other guidelines for the project.

E N D
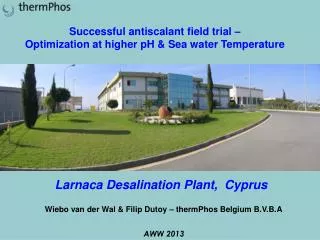
Swakopmund desalination plant EIA: Numerical modelling results Hardus Diedericks CSIR NATURAL RESOURCES AND THE ENVIRONMENT
Outline • Assumed project description • Assumptions and limitations of the study • Model results: waves, hydrodynamics, • brine discharge and sediment transport • Additional requirements • Guidelines
Project description • Provide numerical results to assess potential environmental impacts • Brine disposal at two possible intake/discharge pipe layouts • Sediment impacts at an intake basin • Results are for an EIA
Limitations and assumptions • Assessment based on project description as supplied • Uncertainties: Pipeline locations, orientation, distance between intake and discharge pipes (parallel and perp.)
Limitations and assumptions • Near-field behaviour based on conceptual designs, very near-field not resolved • Diffuser length 200 metres • 3D modelling needs improved input data and calibration data
Wave reliability NCEP vs Slangkop wave climate Annual Hmo exceedance: Slangkop (NCEP) 1% 5% 10% 25% 50% 6.1 4.8 4.2 3.3 2.6 (5.7) (4.4) (3.8) (2.9) (2.3)
Wave applications • Waves are used in hydrodynamic simulations • (per month (season)) • Make a look-up table (rapid transformation) • (1997 – 2008)
Waves at northern discharge position • Pipe orientation • approx 249o • Waves approx 225o • All waves
Waves at locations (10 years) Northern location Southern location Proposed basin
Hydrodynamic modelling • Input requirements • Wind, waves, offshore water temperature, • surface heat fluxes (all concurrent) • Bathymetry, beach profiles, D50 • Calibration and verification data • Simulation periods • Jan 2007 (summer) • June 2007 (winter) • Calm season (still to do)
Required information • Hydrodynamics: wind and atmospheric data • Hydrodynamics: calibration data (ADCP) • Details of discharge and intake pipe locations • Chemical discharged (biocides) • Nearshore beach profiles at basin site • Median grain sizes (offshore and onshore)
Analyses of results • Salinity, temperature, biocides and achievable dilutions • 80% to 99% exceedance contours • Days of exceedance of a selected guideline
WQ Guidelines • Salinity (< 1 psu or < 36 psu; < 40 psu) • Temperature (ΔT < 1ºC; ANZECC) • Biocides (< 3 µg/ℓ) • Achievable Dilutions (nominally > 100)