Understanding Averages: Mean, Median, and Mode Explained
This lesson explores the concepts of mean, median, and mode through a practical example using toilet roll usage. You'll learn how to order values, calculate the median, identify the mode, and understand averages as central values in sets of data. We'll discuss how averages can vary in different scenarios and provide strategies for sharing data equally. By the end of this presentation, you'll be able to determine the most representative value in a given dataset and reflect on your understanding through interactive examples.

Understanding Averages: Mean, Median, and Mode Explained
E N D
Presentation Transcript
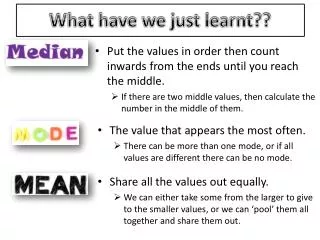
What have we just learnt?? • Put the values in order then count inwards from the ends until you reach the middle. • If there are two middle values, then calculate the number in the middle of them. • The value that appears the most often. • There can be more than one mode, or if all values are different there can be no mode. • Share all the values out equally. • We can either take some from the larger to give to the smaller values, or we can ‘pool’ them all together and share them out.
Averages…. • These are different types of averages.. • An average by definition is ‘a number expressing the central or typical value in a set of data’ In other words (using our toilet roll example)…… How many pieces of toilet roll you would expect a person to take.
Why 3 Averages?? • Le’s go back to our toilet roll problem…. • Imagine 5 people, this is how many pieces of toilet roll they pick…. • PersonA – 3 pieces B – 1 piece C – 2 pieces D – 1 piece E – 23 pieces Now calculate the median, the mode and the mean in this example…. Which of your results would you say was the most average?
Today’s presentations can be viewed again on my blog • http://mrprytherch.wordpress.com • Or google mrprytherch (no space) and my blog comes up 6th!!