Download

1 / 55
570 likes | 1.31k Vues
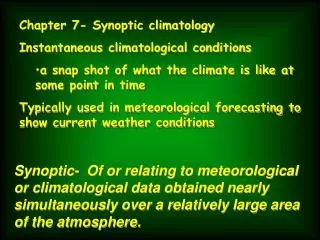
A Statistical Analysis and Synoptic Climatology of U.S. Heat Waves Scott C. Runyon and Lance F. Bosart Department of Earth and Atmospheric Sciences, University at Albany, State University of New York Introduction : Why study heat waves?

E N D
A Statistical Analysis and Synoptic Climatology of U.S. Heat Waves Scott C. Runyon and Lance F. Bosart Department of Earth and Atmospheric Sciences, University at Albany, State University of New York
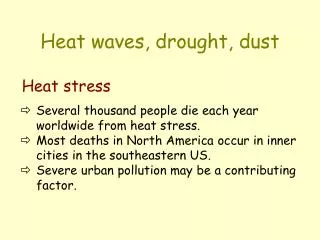
Introduction: Why study heat waves? • Heat waves are a major contributor to weather–related fatalities • Understanding the characteristics of heat waves would lead to improved forecasts • These forecasts may become more critical given the possibility of an increase in the frequency and intensity of heat waves
Introduction (cont.): • Previous work has largely focused on specific heat wave events (e.g. July 1995) or extended “heat wave-droughts” (e.g. 1980 & 1988) • Published synoptic climatologies have been limited in scope to the Midwest or Great Plains (e.g. Chang & Wallace, 1984)
Purpose: • Document differences in heat waves as a function of both season and region • Understand both the dynamical and thermo-dynamical contributions to regional heat waves • Resolve annual and decadal trends in heat wave frequency
Overview: • Methodology/Definitions • Results • Skewed datasets • Northeast heat wave statistics • Case Study: 7-11 June 1984 • Summary • Conclusions • Future Work
Methodology: • Temperature data was extracted from the National Climatic Data Center’s (NCDC) high resolution surface dataset • Database contains daily high temperatures for 54 stations over a 54-year period (1948-2001) • Surface stations were selected on the basis of dataset continuity and geographical coverage
Methodology (cont.): Stations in Database
Methodology (cont.): • Definitions: • An anomalously hot day was initially defined as a day having a high temperature at least 2 standard deviations (σ) above the normal high temperature for the date • This definition was later changed to a day having a high temperature above the climatological 97.5 percentile threshold for the date • A heat wave was defined as three or more consecutive anomalously hot days – no matter the season
Methodology (cont.) • Regions mirror the NCDC Standard Regions for Temperature and Precipitation • Heat waves were considered regional when two or more stations within that region had overlapping warm days • All anomalously hot days, heat waves, and regional heat waves were identified for each station and each region across the country
Results “Skewness” of Daily High Temperature Data • Initially using a 2σ high temperature anomaly to define a hot day a surprising amount of variability in number of heat waves identified from one city to the next • A serendipitous discovery: a discrepancy between number of anomalously cold days and the number of anomalously hot days for most stations in the dataset
Results: Top Ten “Skewed” Cities Positively Skewed Negatively Skewed
Most Negatively Skewed City: Denver • In 54-year dataset, only 49 days met old criteria as anomalously hot days (T≥2σ) • Only 2 heat waves were identified in the entire dataset
Denver, CO Daily High Temperatures – Spring Mean + 2σ Mean Mean - 2σ March 1 – May 31
Denver, CO Daily High Temperatures – Summer June 1 – August 31
Denver, CO Daily High Temperatures – Fall September 1 – November 30
Denver, CO Daily High Temperatures – Winter December 1 – February 29
Most Positively Skewed City: Los Angeles • In 54-year dataset, 989 days met old criteria as anomalously hot days (T≥2σ) • Hence, over 130 heat waves were identified in the dataset
Los Angeles, CA Daily High Temperatures – Spring March 1 – May 31
Los Angeles Daily High Temperatures – Summer June 1 – August 31
Los Angeles, CA Daily High Temperatures – Fall September 1 – November 30
Los Angeles, CA Daily High Temperatures – Winter December 1 – February 29
New Method: • An anomalously hot day is now defined as a day having a high temperature above the daily climatological 97.5 percentile threshold • Heat wave definitions remained unchanged • Updated Figures: • DNR: 736 Days, 41 Heat Waves • LAX: 669 Days, 66 Heat Waves
Stat. Analysis of Northeast Heat Waves Results: • A trend toward more Winter and Spring heat waves with time • A trend toward fewer Summer and Autumn heat waves with time • Decades of the 1950’s, 1980’s and 1990’s had the highest frequency of heat waves
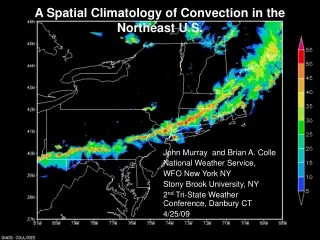
A Case Study: 7-11 June 1984 • A long-lasting, region-wide Northeast heat wave • Both thermodynamic and dynamic signatures can be seen
June 4, 1984 ALB: 80° F LGA: 85° F BOS: 85° F
June 5, 1984 ALB: 84° F LGA: 88° F BOS: 89° F
June 6, 1984 ALB: 81° F LGA: 88° F BOS: 70° F
June 7, 1984 ALB: 89° F LGA: 93° F BOS: 89° F
June 8, 1984 ALB: 93° F LGA: 96° F BOS: 97° F
June 9, 1984 ALB: 93° F LGA: 95° F BOS: 96° F
June 10, 1984 ALB: 91° F LGA: 95° F BOS: 95° F
June 11, 1984 ALB: 90° F LGA: 96° F BOS: 98° F
June 12, 1984 ALB: 82° F LGA: 84° F BOS: 85° F
June 4, 1984 ALB: 80° F LGA: 85° F BOS: 85° F
June 5, 1984 ALB: 84° F LGA: 88° F BOS: 89° F
June 6, 1984 ALB: 81° F LGA: 88° F BOS: 70° F
June 7, 1984 ALB: 89° F LGA: 93° F BOS: 89° F
June 8, 1984 ALB: 93° F LGA: 96° F BOS: 97° F
June 9, 1984 ALB: 93° F LGA: 95° F BOS: 96° F
June 10, 1984 ALB: 91° F LGA: 95° F BOS: 95° F
June 11, 1984 ALB: 90° F LGA: 96° F BOS: 98° F