Download
1 / 31
310 likes | 329 Vues
This study explores the occurrence and characteristics of heat waves in the Northeast United States. By analyzing temperature data and synoptic patterns, the research aims to improve understanding and forecasting of heat waves, which can have significant impacts on human health and safety.

E N D
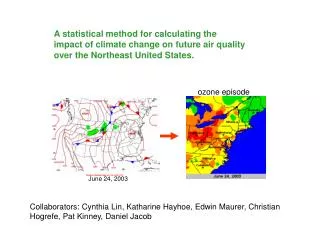
A Statistical Analysis and Synoptic Climatology of Heat Waves over the Northeast United States Scott C. Runyon and Lance F. Bosart Department of Earth and Atmospheric Sciences, University at Albany, State University of New York
Overview/Motivation • Heat waves are a major contributor to weather-related fatalities • From 1986 to 2004: Source: www.nws.noaa.gov/om/severe_weather/65yrstats.pdf
Overview/Motivation (cont.) • Improved forecasting may result from a better understanding of conditions antecedent to and during heat waves • These improved forecasts may become critical given the possibility of an increase in frequency & intensity of heat waves
Overview/Motivation (cont.) • Previous work has largely focused only on individual events (e.g., McQueen et al. 1956, 1957; Livezey and Tinker 1996) or on extended “heat wave–droughts” (e.g., Namias 1982, 1991) • Published synoptic climatologies have been limited in scope to “Midwest” or Great Plains (e.g., Namias 1955, 1983; Chang & Wallace 1984)
Goals • Resolve annual and decadal trends in heat wave frequency nationwide • Investigate conditions that lead to onset of Northeast heat waves • Understand synoptic evolution of and dynamic contributions to Northeast heat waves
Overview • Methodology • Initial • Revised • Results • Northeast vs. regional heat wave statistics • Northeast summer heat wave composites • Antecedent conditions • Evolution of heat waves • Conclusions
Methodology • Temperature data were gathered from the National Climatic Data Center’s (NCDC) high resolution surface dataset • Daily high temperatures were extracted for 54 surface stations over a 54-year period (1948–2001) • Stations selected on basis of both dataset continuity and coverage within the NCDC’s Standard Regions for temperature and precipitation
Methodology (cont.) • An anomalously hot day was initially defined as a day having a high temperature ≥ 2 standard deviations (σ) above the normal* high temperature • Result: • Large variability in number of anomalous warm events between stations • Extreme ratios of anomalously hot days to anomalously cold days at many stations
Methodology (cont.) This initial method led to a discovery: High temperatures at most stations are not normally distributed(“skewed”) Negatively Skewed Positively Skewed DEN 94.2 5.8 LAX 5.7 94.3
Methodology (cont.) • Temperature data is widely assumed to be normally distributed • Los Angeles, CA and Denver, CO: • Most positively and negatively skewed datasets, respectively • Using 2σ method 989 (49) anomalously hot days were found in Los Angeles (Denver) for all seasons
Methodology (cont.) Most Positively Skewed Station:Los Angeles, CA
Methodology (cont.) Los Angeles, CA: Daily High Temperatures Mean +2σ Mean Mean −2σ June 1 – August 31, 1948 –2001
H L Los Angeles, CA: Composite Mean Sea Level Pressure (hPa) – Ten Most Anomalous Warm Summer Days
Methodology (cont.) Los Angeles, CA: Daily High Temperatures September 1 – November 30, 1948 – 2001
H L Los Angeles, CA: Composite Mean Sea Level Pressure (hPa) – Ten Most Anomalous Warm Autumn Days
Methodology (cont.) Los Angeles, CA: Daily High Temperatures December 1 – February 29, 1948 –2001
H L Los Angeles, CA: Composite Mean Sea Level Pressure (hPa) – Ten Most Anomalous Warm Winter Days
Methodology (cont.) Los Angeles, CA: Daily High Temperatures March 1 – May 31, 1948 – 2001
H L Los Angeles, CA: Composite Mean Sea Level Pressure (hPa) – Ten Most Anomalous Warm Spring Days
Methodology (cont.) Most Negatively Skewed Station:Denver, CO
Methodology (cont.) Denver, CO: Daily High Temperatures Mean +2σ Mean Mean −2σ June 1 – August 31, 1948 –2001
H L Denver, CO: Composite Mean Sea Level Pressure (hPa) – Ten Most Anomalous Cold Summer Days
Methodology (cont.) Denver, CO: Daily High Temperatures September 1 – November 30, 1948 – 2001
H L Denver, CO: Composite Mean Sea Level Pressure (hPa) – Ten Most Anomalous Cold Autumn Days
Methodology (cont.) Denver, CO: Daily High Temperatures December 1 – February 29, 1948 – 2001
H L Denver, CO: Composite Mean Sea Level Pressure (hPa) – Ten Most Anomalous Cold Winter Days
Methodology (cont.) Denver, CO: Daily High Temperatures March 1 – May 31, 1948 – 2001
H L Denver, CO: Composite Mean Sea Level Pressure (hPa) – Ten Most Anomalous Cold Spring Days
Methodology (cont.) • Los Angeles: • Large temperature anomalies more likely positive and associated with Santa Ana (offshore) events • Typically, marine layer moderates daily high temperatures • Denver: • Large temperature anomalies more likely negative and associated with upslope events • Typically, mean westerly, downsloping flow influences daily high temperatures • Non-normal temperature distributions are common and have distinct physical explanations
Methodology (cont.) • Anomalously hot day: A day having a high temperature greater than the daily climatological 97.5 percentile threshold • New method eased distribution problems [Los Angeles 669, Denver 736] • Heat wave: Three or more consecutive anomalously hot days • Regional heat wave: When heat waves occurring at two or more stations within a region had at least one overlapping day