Download
1 / 22
220 likes | 350 Vues
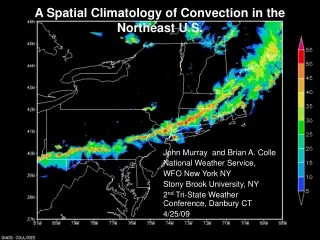
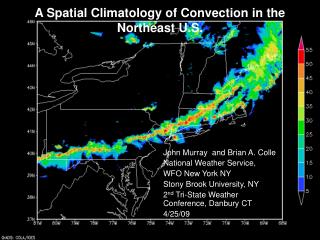
A Spatial Climatology of Convection in the Northeast U.S. John Murray and Brian A. Colle National Weather Service, WFO New York NY Stony Brook University, NY 2 nd Tri-State Weather Conference, Danbury CT 4/25/09. Motivation.

E N D
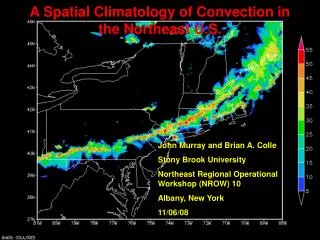
A Spatial Climatology of Convection in the Northeast U.S. John Murray and Brian A. Colle National Weather Service, WFO New York NY Stony Brook University, NY 2nd Tri-State Weather Conference, Danbury CT 4/25/09
Motivation There is little understanding of the spatial distribution of convection over the Northeast U.S. and the relationship with different geographical features. How do the preferred regions for convective activity over the Northeast vary diurnally and during the warm season? How does convection evolve around terrain, coastal geometry, and urban areas? What are the different flow patterns associated with the convective maximum and minimum areas across the Northeast?
Observational Datasets and Approach • Cloud to Ground Lightning Data National Lightning Detection Network (NLDN) • Available 2000-2007 • Interpolated to a 10x10 km grid centered over the Northeast U.S. • NOWrad (WSI NCAR): WSR-88D • Use NOWrad every 2x2 km2 at 15 minute interval (largest reflectivity at a point from surrounding radars) • Composite from April through September 1996-2007 by counting frequency of reflectivity exceeding a threshold (45 dBZ for this study unless otherwise mentioned) WSR 88D coverage at 3km above MSL, from Maddox et al 2002 Figure from thunder.msfc.noaa.gov
Radar Composites compared with cloud to ground lightning data • For 2001-2007: • 30 warm season months included from May 2001 through August 2007 • May missing for 2001, 2003, June missing in 2003, September missing for 2006, 2007
Diurnal tendency variation between 1st (April-June) and 2nd (July-August) half of warm season Increase in daytime convection along coastal plain and Hudson Valley and greater nighttime convection over the ocean during the July-September period.
1 3 4 5 2
1 2 3 4 5 3 2 1 4 5
Topography (m) and Echo Frequency % of Time Composite Reflectivity ≥ 45dBZ averaged across 38.5 through 41.5 N
Favored Genesis and Decay Locations for Organized Convection • Count all convective events of at least 3° longitude in width with ≥ 30 % echo frequency. • For example,
Genesis Decay Total Amount of streaks = 219
Convective Frequency over the Northeast vs. Flow Regimes and Synoptic Conditions For 500 hPa • Using NARR (North American Regional Reanalysis) Available every 3 hours at 32 km resolution • Convective hours related to nearest NARR time or convective hours plotted for certain conditions in an area as denoted by NARR • Goal is to better understand the evolution of convection and convective flow regimes X X X X For 925 hPa X X X X
Convective Frequency vs. Wind Direction at 500 hPa SW->W (226-270), W->NW (271-315)
Convective Frequency vs. Wind Direction at 925 hPa SE->SW (145-225), SW->NW (225-315) for western Long Island
Evolution of Convection • What synoptic conditions favor deep convection over the coastal waters? • Approach: Take two adjacent boxes and compute areal means of convective frequency (or 45+dBZ frequency), and list out days in which there was > 1 standard deviation of the mean. • Then list out the times in which convection decreased by at least 50 % from one box to another. 3 4 5
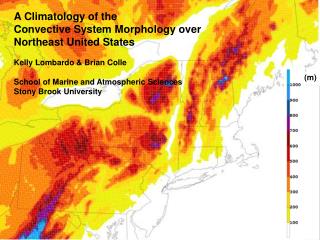
Summary • Convection (≥ 45dBZ) varies across the region, with localized maxima across western PA, Hudson Valley, and along the coastal plain from VA to NJ. • Convection is a maximum over inland locations during the day (18-00 UTC), and this maximum moves to the coastal ocean by the late night (03-09 UTC). • The favored genesis regions of organized convection are from the Midwest and central and eastern Appalachians. Decay occurs just west of the Appalachians and in the coastal areas. • Convection is most frequent over inland locations with SW-W flow at 500mb. Southerly flow at 925mb results in a greater influx of marine air into southern New England resulting in a larger gradient of convective frequency west to east. • Generally, for enhanced coastal convection, there is a little low-level CAPE, but there is a well defined surface trough, with convection developing along a west-east baroclinic zone.
Reference to any specific commercial products, process, or service by trade name, trademark, manufacturer, or otherwise, does not constitute or imply its recommendation, or favoring by the United States Government or NOAA/National Weather Service. Use of information from this publication shall not be used for advertising or product endorsement purposes. Use of lightning data by the NWS provided through a license agreement with Vaisala/GAI.