Download
1 / 34
760 likes | 2.17k Vues
Silicon Drift Detectors: Understanding the Advantages for EDS Microanalysis. Patrick Camus, PhD Applications Scientist March 18, 2010. EDS Detector Requirements. Detect whole energy range of x-rays 50 eV (Li-K) to incident beam energy SEM: up to 30 keV

E N D
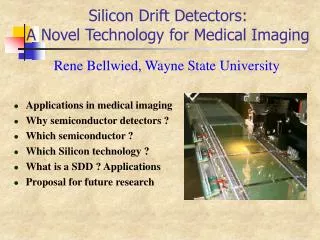
Silicon Drift Detectors:Understanding the Advantages for EDS Microanalysis Patrick Camus, PhD Applications Scientist March 18, 2010
EDS Detector Requirements • Detect whole energy range of x-rays • 50 eV (Li-K) to incident beam energy • SEM: up to 30 keV • (S)TEM: up to 300 keV, realistically up to 50 keV • Lower limit set by intrinsic noise of system • Good spectral resolution • Separate closely spaced energy peaks • Varies with x-ray energy • Theoretical limit based on sensor material, sensor design and system noise • High x-ray detection rates • Reduced collection times • Fast sensor response to reduce detection overlap • Physical geometry to maximize x-ray collection • Shorten the sample-to-detector distance • Leave enough physical room for other detectors and accessories
Entrance window EDS Sensor Technologies Si(Li) Diode Silicon Drift INPUT X-RAYS INPUT X-RAYS Not to Scale Different geometries provide different absorption and electrical pulse characteristics
SDD Fabrication Technology Semiconductor Operating Temperature 230~250 K at the sensor Peltier cooled Most have convective cooling Some have fans (vibration) Sensor thickness 0.5 mm Good sensitivity up to 10 keV Reduced sensitivity until 20 keV Electric Field and Electron Path Radial field Low capacitance Si(Li) Fabrication Technology Discrete components Operating Temperature 77~130 K at the sensor LN2 Peltier+Water or refrigeration Sensor thickness 3 mm Good sensitivity up to 20 keV Reduced sensitivity until 50 keV Electric Field and Electron Path Axial field High capacitance Comparison of SDD to Si(Li) Technology
Si(Li) Detector Features • Sensitive to ~70 eV (Be-K) x-rays • Good sensitivity above 20 keV • Parallel-plate contacts • High capacitance • Medium throughput rates • Extreme cooling required • Reduce electronic noise • Good spectral resolution: 129 eV @ Mn-Kα • Degrades substantially with increased input count rate • Limits usable throughput maximum
Si(Li) Detector Performance • Spectral Resolution • Shorter shaping times means degraded resolution • 100µs, 4µs, 2µs, 1µs • 129 eV to >200 eV • 5k cps input to 130k cps input • Throughput curve • Shorter shaping times produces more output at same input • Increased dead time % cause peak • Operation past peak is counter-productive
History of Silicon Drift Detectors (Abridged) • 1983 Emilio Gatti and Pavel Rehak (Brookhaven National Lab) Silicon Drift Chamber • 1995 Rontec (now Bruker) in cooperation with MPI and Ketek introduce EDS and XRF SDD detectors • 1997 Photon Imaging (now Seiko) introduce XRF SDD detector • 2000-2007 All major EDS companies introduce SDD technology for electron beam instruments • Notable EDS Dates • 2004 Peak and resolution stability from Thermo Fisher Scientific • 2006 Quad 10mm2 detector from Bruker AXS • 2006 30mm2 SDD from Thermo Fisher Scientific • 2007 Good low-energy (Be-K) performance from Thermo Fisher Scientific • 2008 80mm2 SDD from Oxford Instruments
Silicon Drift Detector Features • High input count rate capability up to 106 cps. • Comfortable operation – Peltier cooling @ -10°C to -60°C • Good energy resolution down to 124 eV @ Mn-Kα • Maintains good energy resolution as input count rates increase • Size and shape limited only by fabrication technology
Electron Potential and Trajectories Silicon Drift Detector Benefits • Small capacitance • Small electrical contact • Low noise for better spectral resolution • High input and output count rates • Integration of first FET • Further noise improvement • No pickup, no microphony
Types of Silicon Drift Detectors • Concentric rings • Allows large areas with good resolution • Droplet rings • For small devices hides the pickup and FET under the collimator • Discreet FET • Lower noise potential in FET • Complex manufacturing and sensitive to microphonics • Integrated FET • Higher count rates due to lower capacitance
Si(Li) SDD 0 2 4 6 8 10 12 14 16 18 20 keV Quantum Efficiency Comparison • High energy x-rays: • Are detected by the “thick” Si(Li) sensor. • Penetrate through the “thin” SDD sensor • Si(Li) sensors are more sensitive for high energy x-rays • (S)TEM applications
Spectral Resolution Prediction • FWHM = (5.5 F ε E + N2 )½ • Where: • F = Fano Factor, ~0.1 for Si • ε = 3.8 eV for Si • E = X-ray Energy of interest • N is FWHM of electronic Noise • For a given sensor material and x-ray energy, the “F ε E” term is a constant • If N = 0 eV, then limiting resolution for a Silicon-based detector is ~100eV at Mn-Kα • Current Mn-Kα resolutions are ~124 eV, placing N ~ 55 eV • Reducing the electronic noise is the primary method to improving spectral resolution!
Total capacitance Ctot 1/f noise coeff. af Leakage current IL Transconductance gm Filter constants Ai Shaping time constant T Electron charge q α = 2/3 for FET 2 kT 1 ENC α C A 2 π a C A q I A τ 2 2 2 = + + tot tot 1 2 L 3 f g τ m leakage current 1/f noise thermal noise Electronic Noise (ENC) Analysis • Ctot: Si(Li) >> SDD (intrinsic design) • IL: Si(Li) << SDD (but dropping) • For Si(Li): • Leakage current is not a factor • 1/f noise dominates at high shaping times • For SDD: • Small capacitance “eliminates” 1/f contribution • Small capacitance reduces thermal noise to very small shaping times
Effect of Temperature on SDD Spectral Resolution Decreasing the device temperature makes the resolution better
Effect of Temperature on SDD Spectral Resolution - 2 • Decreased temperature improves resolution • Sensor can be run at Room Temperature, but does not meet specifications. • Effect is less dramatic with more cooling
Mn Resolution Comparison • Both Si(Li) and SDD start at low values • Specifications appear similar • Si(Li) degrades faster with increasing input count rate • Slow response of diode geometry • SDD degrades slowly with increasing count rate • Fast response of radial field geometry • Better resolution at 7x input count rate • SDD maintain their good resolutionthroughout the input range • Specification resolution is not the primary advantage of SDD
New Generation Electronics Offer Spectral Stability • As input count rate increases using a constant shaping time: • Old self-reset mode produced varying resolution and peak locations • New pulse-reset mode produces stable resolution and peak locations • FWHM of Mn-Kαincreases less than 4 eV • Peak shift reduced to less than 8 eV
Resolution Does not vary with dead time % Degrades as shaping time decreases SDD Peak and Resolution Stability for Mn-K • Peak location • Does not vary with dead time % • Does not vary with shaping time
SDD Spectral Resolution Stability • Superior electronics permit stable resolution values across the spectrum as the count rate increases.
SDD Spectral Resolution Display • All peak shapes are indistinguishable from 5k to 100k cps input
SDD Mn Throughput • A variety of electronic shaping time settings permits the best possible spectral resolution at each input count rate. • Slower shaping times provide better resolution but lower output rates • Faster shaping times provide higher output rates but at lower resolution
SDD Mn Throughput Display • The resolution display does not change significantly until the final shaping time of 200 ns (800k cps) is used.
Low Energy Performance • Be spectrum • BN spectrum • Same sensitivity as Si(Li)
Sensor Size: Bigger is Better • A larger sensor size has the potential to collect more x-rays than a smaller sensor size. • However, the real metric of x-ray detection is the solid-angle subtended by the detector. • The solid-angle (SA) is defined as: • SA = A / D2 • Where: • A = active area of the sensor in mm2 • D = sample-to-sensor distance • For the same D, a larger A detector is preferred. • HOWEVER …..
Sensor Size: When Bigger is Not Always Better • The physical geometry of the detector housing may restrict the location of the detector inside a chamber. • A larger area sensor may require a larger diameter housing. • If that housing conflicts with other structure inside the chamber, then its location may need to be changed. • This change may require and increase in D to a clear location. • This new D adversely affects the SA value. • It is entirely possible that a larger area detector in a large housing mounted at a larger distance may actually collect less x-rays than a smaller area detector in a smaller housing at a shorter distance!
Detector Solid-Angle Comparison Solid Angle = Area / Distance2 30 mm2 sensor in 19 mm tube @ 43 mm: SA = 16.2 msr 80 mm2 sensor in 35 mm tube @ 71 mm: SA = 15.9 msr
Good spectral resolution permits easy isolation, identification, and measurement of peaks If peak locations are greater than ~2x resolution: Peaks are isolated Peak identification is trivial Net peak counts can be measured manually Software is needed for quantification If peak locations are less than ~2x resolution: Peaks overlap in display Peak identification becomes difficult Software is needed for proper background removal and net counts measurement Software is needed for quantification Spectral Resolution Requirements
In practice, there are potentials for many peak overlaps Most spectra require software to analyze peaks, even at highest resolution Robust routines were developed in the 1970’s and 1980’s to deal with peak overlaps Peak identification Peak deconvolution Net count measurement These routines were designed for detectors with a best resolution of ~145 eV @ Mn-K Spectral Resolution Limits
Spectral Appearance • “Low Beam” = 10k cps “High Beam” = 250k cps • Longer shaping time produced more visible peaks • Al-K resolution: 78 eV vs. 139 eV • Not enough resolution to separate all peaks, even at “Low Beam” (best resolution) • Software is required for data analysis • With equal data quality, what is more important: data display or acquisition time?
SDD Demonstration • Spectral Acquisitions • Spectral Imaging (Mapping) Acquisitions
Summary • Silicon-drift technology is relatively young • Still being enhanced • Silicon-drift detectors have very few limitations for EDS analyses • High-energy x-rays • SDD have many advantages, especially for high throughput applications • Cooling • Resolution degradation • Maximum storage rate • Detector electronics are just as important as the sensor • Solid angle is a more important metric than sensor size • Spectral resolution is visually appealing, but software processing is still required for spectral (and mapping) analyses
Conclusions • Analytical results are obtained faster and at the same confidence with an SDD. • SDD performance can only get better.