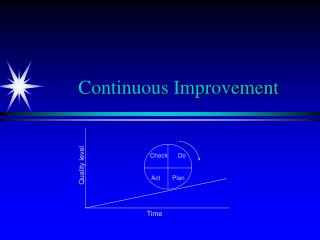
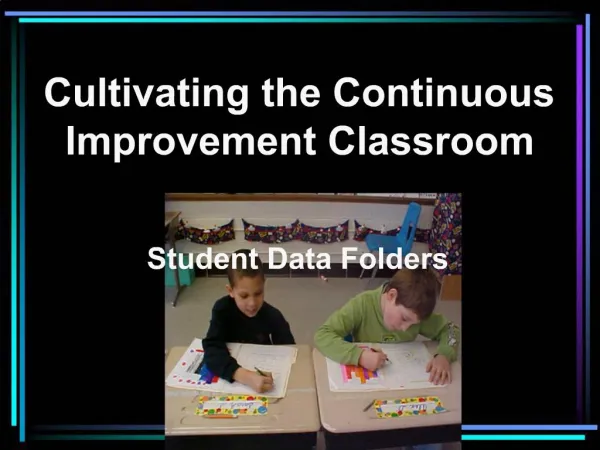
The Continuous Improvement Classroom
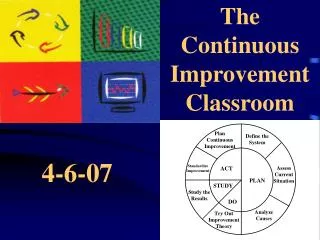
The Continuous Improvement Classroom. PDSA. What is PDSA?. Worksheet Y. Plan Continuous Improvement. Define the System. Standardize Improvement. ACT. Assess Current Situation. PLAN. STUDY. Study the Results. DO. Analyze Causes. Try Out Improvement Theory. Worksheet V.

The Continuous Improvement Classroom
E N D
Presentation Transcript
What is PDSA? Worksheet Y
Plan Continuous Improvement Define the System Standardize Improvement ACT Assess Current Situation PLAN STUDY Study the Results DO Analyze Causes Try Out Improvement Theory Worksheet V
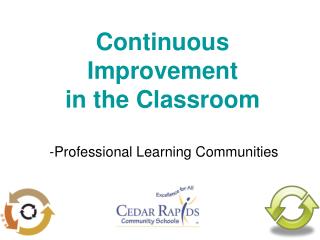
PDSA; The Vehicle Professional Learning Communities Use To Implement Change
ITBS Language Total Scores This data shows “the big picture” of language proficiency …
This data “digs deeper” through sub test areas of language skills…
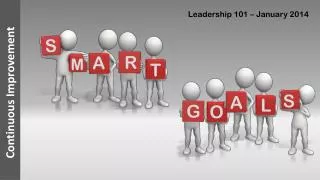
Next Steps… • The Building Leadership Team writes a SMART Goal that is included in the School Improvement Plan (SIP) • Then, the Action Research Team utilizes the PDSA process to work on the goal
So.. After reviewing vocabulary assessment data, teachers discuss options at a team meeting and use the PDSA process They define how they are currently teaching vocabulary (flowcharts) The team determines what other in-process measures they could use to see how students are doing in vocabulary and they collect data (run charts & pareto diagrams) to get baseline The team reviews the baseline data they collected and discuss root causes for the results they see (cause & effect diagrams & relations diagrams) Once root causes are identified, each member researches articles and best practices related to vocabulary instruction and submits the best to the group (improvement theory)
Teams continue to use the PDSA cycle to make improvements in the realm of their professional learning community Members reflect, observe, practice, receive feedback, gain expertise and standardize the new vocabulary instruction practice (new flowchart) Members monitor student data to determine effectiveness of strategies (compare to baseline) Members coach each other & may go into each others classroom to observe and provide feedback The team writes an action plan to carry out the improvement theory in their classrooms. Members practice newly-learned strategies (improvement theory), and measure the effectiveness of the strategies
From High Stakes Assessment to In-Process Measures • Mistaken Belief: “It’s the adults who use assessment results to make the most important instructional decisions…” • Mistaken Belief: “The most important decisions are made annually based on annual high-stakes tests”
What Do Your In-Process Measures Look Like? • Give some examples of “in process” measures? • How would you use them in… • The Data Center • Student Data Folders • PDSA Efforts?
The Problem- Students aren’t waiting to be called on during instruction Define the System Plan
Define the SystemFlow Chart I have an idea I raise my hand Did my teacher call my name? no Blurting out anyway yes Share my idea out loud
Let’s collect some data to see how our system is currently operating. Assess Current Situation Plan
Let’s figure out what’s causing the problem Plan Analyze Causes
Driving Forces We have good ideas Sometimes we remember Restraining Forces We get excited We have a lot to say We forget We don’t like to wait Analyze CausesForce Field Analysis
Let’s try something different to improve the behavior Plan Do Try Out Improvement Theory
DOTry Out Improvement Theory • IF we try hard to remember to raise our hands, and hang the run chart in a place we can all see to help us remember, • THEN, we will remember to raise our hands before we speak instead of talking out.
Let’s see how our theory worked. Did we make improvements? Plan Study Study the Results Do
If it worked, let’s standardize our improvements. Plan for Continuous Improvement Standardize Improvement Act Plan Study Do
Baseline Data (Before) After (Results)
Creating PDSA Storyboards Telling Your Continuous Improvement Story!
What is a PDSA Storyboard? • A graphical representation of continuous improvement efforts • Purpose: To communicate progress to stakeholders • Includes meaningful artifacts, data and quality tools • Is organized around the PDSA wheel
Plan Continuous Improvement Define the System Standardize Improvement ACT Assess Current Situation PLAN STUDY Study the Results DO Analyze Causes Try Out Improvement Theory
Classroom PDSA Examples Worksheet X
Sharing • How could you involve students in the PDSA process in your classroom? • What are the “probletunities” that students could help solve? • How could data folders and data centers help involve students in PDSA?
Debriefing PDSA Worksheet Y