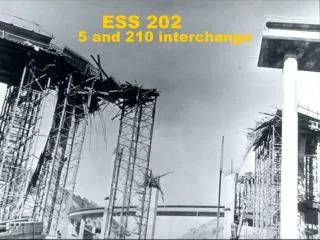
ESS 202
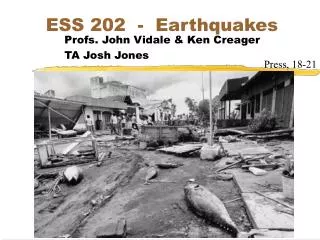
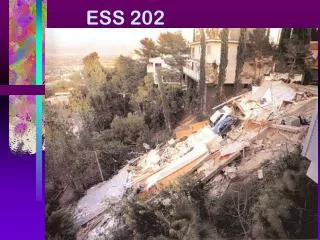
ESS 202. House after tsunami, Brumbaugh 8-18. Today: The Size of an Earthquake. Intensity Magnitude Moment. Earthquake effects. Natural Hazards Ground shaking Structural collapse Falling objects Ground settling Landslides and avalanches Fault offset Tsunamis and seiches. Landslide.

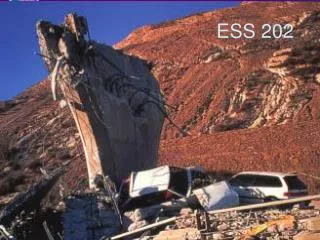
ESS 202
E N D
Presentation Transcript
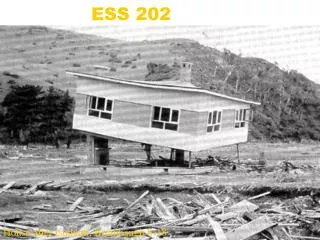
ESS 202 House after tsunami, Brumbaugh 8-18
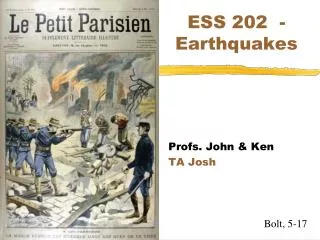
Today: The Size of an Earthquake • Intensity • Magnitude • Moment
Earthquake effects • Natural Hazards • Ground shaking • Structural collapse • Falling objects • Ground settling • Landslides and avalanches • Fault offset • Tsunamis and seiches
Landslide Bolt, 12-11
More quake effects • Man-aided hazards • Floods from dam failure • Fires • Toxic spills
Measuring earthquakes • 1. Felt reports - Intensity • Not precise, but best data for old earthquakes • 2. Seismic measurements • 3. Mapping of rupture zone • 4. Geodetic measurements of ground shift
Measuring earthquake size • 1. Intensity - IX • 2. Magnitude - 7 • 3. Seismic moment - 1020 N-m
Intensity • Measures shaking and damage • Obtained from • the damage done to buildings • changes in Earth’s surface • felt reports • Uses Modified Mercalli Intensity Scale • shaking levels from I to XII • Useful for historical earthquakes, described in old newspapers, personal accounts, etc.
Liquefaction in Watsonville in 1906 San Francisco Earthquake Kovach, 3-9
Limitations of Intensity • Not a true measure of size because • depends on distance from epicenter, and • varies with building practices, and • varies with rock or soil type. • So the same earthquake will shake different places with different intensities. • But maximum intensity experienced in a given earthquake correlates with that earthquake’s magnitude.
Barely felt • I. Not felt by people except under especially favorable circumstances. • II. Felt only by persons at rest on the upper floors of buildings. Some suspended objects may swing. • III. Felt by some people who are indoors, but it may not be recognized as an earthquake. The vibration is similar to that caused by the passing of light trucks. Hanging objects swing. The Modified Mercalli scale is also on the web
Felt (more) • IV. Felt by many people who are indoors, by a few outdoors. At night some people are awakened. Dishes, windows and doors are disturbed; walls make creaking sounds; stationary cars rock noticeably. The sensation is like a heavy object striking a building; the vibration is similar to that caused by the passing of heavy trucks.
Felt (still more) • V. Felt indoors by practically everyone, outdoors by most people. At night, sleepers are awakened and some run out of buildings. Liquids are disturbed and sometimes spilled. Small unstable objects and some furnishings are shifted or upset. Doors close or open.
Hazardous • VI. Felt by everyone, and many people are frightened and run outdoors. Walking is difficult. Small church and school bells ring. Windows, dishes, and glassware are broken; liquids spill; books and other standing objects fall; pictures are knocked from the walls; furniture is moved or overturned. Poorly built buildings may be damaged, and weak plaster will crack.
Worse hazard • VII. Causes general alarm. Standing upright is very difficult. Persons driving cars also notice the shaking. Damage is negligible in buildings of very good design, slight to moderate in well-built ordinary structures, considerable in poorly-built structures. Some chimneys are broken; interiors experience considerable damage; architectural ornaments fall. Small slides occur along sand or gravel banks of water channels; concrete irrigation ditches are damaged. Waves form in the water and it becomes muddied.
Big problem • VIII. General fright and near panic. The steering of cars is difficult. Damage is slight in specially designed structures, considerable in ordinary buildings. Poorly built or designed buildings experience partial collapses. Numerous chimneys fall; the walls of frame buildings are damaged; interiors experience heavy damage. Frame houses that are not properly bolted down may move on their foundations. Decayed pilings are broken off. Trees are damaged. Cracks appear in wet ground and on steep slopes. Changes in the flow or temperature of springs and wells are noted.
Bigger problem • IX. Panic is general. Interior damage is considerable in specially designed structures. Ordinary buildings suffer severe damage with partial collapses; frame structures thrown out of plumb or shifted off their foundations. Unreinforced masonry buildings collapse. The ground cracks conspicuously and some underground pipes are broken. Reservoirs are damaged.
Quite a problem • X. Most masonry and many frame structures are destroyed. Even specially designed structures may suffer serious damage. Some well-built bridges are destroyed, and dams, dikes, and embankments are seriously damaged. Large landslides are triggered by the shock. Water is thrown onto the banks of canals, rivers, and lakes. Sand and mud are shifted horizontally on beaches and flat land. Rails are bent slightly. Many buried pipes and conduits are broken.
Rarely, if ever, seen • XI. Few, if any, masonry structures remain standing. Other structures are severely damaged. Broad fissures, slumps and slides develop in soft or wet soils. Underground pipe lines and conduits are put completely out of service. Rails are severely bent. • XII. Damage is total, with practically all works of construction severely damaged or destroyed. Waves are observed on ground surfaces, and all soft or wet soils are greatly disturbed. Heavy objects are thrown into the air, and large rock masses are displaced.
Intensity Map • Shows contours of areas with a similar level of damage on the Modified Mercalli scale. New Madrid, 1812
Intensity Map • Shows contours of areas with a similar level of damage on the Modified Mercalli scale. • Guessed from measurements at 10 to 100’s of locations. • Mainly comes from places with buildings. • Not a direct measurement of ground motion. • Intensity maps still being made. • But scientists don’t use them much now • Mainly useful for • comparing historical earthquakes with current ones • and showing public what shook how much
Hector Mines Earthquake, Oct. 16, 1999
1929 Whittier, CA quake • 8:46 am, July 8th, M = 4.7 • Dawn of earthquake science • Some new instruments, gung-ho group • Callers reported strong shaking in Whittier • Not noticed by scientists in Pasadena • Scientists jump in car and drive south • Interesting as an example of technique • The measurement of intensity New Zealand 1929
DrivingwithRichter Richter’s Lab CIT Richter, 4-4
Notes from the drive And so on, for two more days Richter, p. 38
East Whittier School - 1929 Richter, 4-5
Loma Prieta as example18 October 1989 • Faulting details • 40 km by 20 km rupture area • Up to 4 meters of slip • M = 7 (not defined until later in lecture) • $10,000,000,000 in damage and 62 deaths • Mostly right-lateral motion on San Andreas • 12 special volumes, ~300 papers • Was first big California quake for a while
Fault slip in Loma Prieta quake Bay Area Santa Cruz Watsonville Pacific Ocean (two different models for rupture are shown P. Martin Mai, Stanford
Loma Prieta isoseismals • I’m not sure why this map was made. • Technique is obsolete. • Maybe done to compare with older quakes that only had isoseismal damage data. • Maybe bad habits are hard to break. • Also, note that although there are many faults, only part of one broke in this earthquake.
Loma PrietaIntensity map Rupture Monterey! J. Louie
Loma Prietaliquefaction Bolt, 9-3
Magnitude • Measure of the earthquake size • Determined from seismograms • Determined by • taking the logarithm of the largest ground motion recorded during a particular seismic wave type • applying a correction for distance from seismometer to the epicenter • Several types of magnitude • depends mainly on seismic wave type (e.g., P, S, or surface)
Size: Magnitude • Logarithms are used because earthquakes and resulting ground motion range over many orders of magnitude in size (energy) • Correction for distance used because amplitude decreases with distance from the earthquake • as energy spreads out over larger area • Seismometers aren’t always at the same distance from earthquake
Logarithms Diff is 3 • Log10 10X = X • log10 1,000,000 = log10 106 = 6 • log10 1,000,000,000 = log10 109 = 9 • log10 1023 = 23 • log10 1 = log10 100 = 0 • log10 0.0001 = log10 10-4 = -4 • log10 2 = log10 100.3 = 0.3 Manageable numbers Also handles small numbers
Wave amplitude Each kind of wave (phase), such as the P wave, S wave, or surface wave, has its own amplitude at each station for each earthquake.
Charles Francis Richter • 1900-1985 • Made Richter scale in 1935 Never had a grad student. Held the phone in his lap so no one else could answer first. Dedicated nudist. Had a seismometer on his coffee table.
Local or Richter magnitude • ML = log10 (A) where • A is the maximum seismic wave amplitude in microns (10-6 m) recorded on a standard seismograph (Wood-Anderson) at a distance of 100 km from the epicenter P S surface A
Wood-Anderson Mirror on a copper wire Richter, p. 221
Local or Richter magnitude • If seismograph not 100 km from epicenter: • ML = log10 (A) + C(distance) where • A is the maximum seismic wave amplitude in microns (10-6 m) recorded on a standard seismograph • C is a correction factor that is a function of distance from the seismograph to the epicenter surface P S A
Examples • If amplitude is 1 micron =1/1000 mm then ML=0 • If amplitude is 1 mm then ML=3 • If amplitude is 1000 mm then ML=6 • Amplitude is on instrument, not ground motion
Richtermagnitude Bigger amplitude => bigger magnitude Greater distance => bigger magnitude Bolt, Box 7-1
Types of Magnitude • ML - Local or Richter magnitude • Original magnitude, developed by Charles Richter in 1930’s • uses S wave recorded within 300 km of epicenter • mb - Body-wave magnitude • uses P wave recorded at 30° to 90° distance • MS - Surface wave magnitude • uses surface wave • MW - Moment magnitude • uses seismic moment - Next
How small can earthquakes get? • The magnitude scale has no intrinsic upper or lower limit. • Earthquakes with magnitude as small as -2 have been recorded by very sensitive seismometers. • log 0.01 = -2 • Released energy equivalent to that produced when a brick is dropped from a table to the ground.