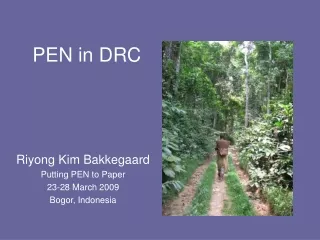
PEN in Uganda
90 likes | 132 Vues
PEN in Uganda. CIFOR, March 2009. Pam Jagger, Workshop in Political Theory and Policy Analysis School of Public and Environmental Affairs, Indiana University. I. Context. Tropical high forest Altitudes between 1000-1800 m.a.s.l. 1000; 700; 800 sq. kms Villages (n=18)

PEN in Uganda
E N D
Presentation Transcript
PEN in Uganda CIFOR, March 2009 Pam Jagger, Workshop in Political Theory and Policy Analysis School of Public and Environmental Affairs, Indiana University
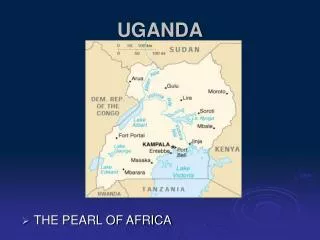
I. Context • Tropical high forest • Altitudes between 1000-1800 m.a.s.l. • 1000; 700; 800 sq. kms • Villages (n=18) • Range: 43 to 244 (avg.=118) • Households (n=540) • Avg. hhd size 6.0 • Variability: • Market access • Ethnic diversity • Migrant populations Lake Albert
II. Household incomes sources 1 USD = 1817 UgShs.
III. Income sources and seasonality • Forest and env. product harvest inc. when crop production down (Q1/Q3) • Forests support a lot of current consumption – but with critical nutrition implications
IV. Key forest and environmental products • How was pricing done: • Quarterly village level price surveys • Collection of conversion factor data so that average prices per standardized unit could be calculated • Collection of time use and average wage rate data on quarterly basis – but limited data on forest and environmental income harvesting
V. Income composition and poverty 1 USD = 1817 UgShs.
VI. Other patterns • Only 2 percent of households reported using forests to cope with shocks • Most common coping mechanisms: • Spend savings (21.4%) • Do nothing (18.2 %) • Help from friends (15.1 %) • Pathway out of poverty? • The relatively wealthy who cut timber are better off – but no evidence of the poor lifted into higher quintiles • Market access • Hard to make sense of data - + and - correlations
VII. Policies and overall findings • Policy mechanisms to substantively increase forest-based income for the poor are few and a challenge to implement • Forest sector governance reform has had a negative effect on both forest cover and the share of forest income for the poorest households • Forest fragmentation has implications for what we call “forest income” • Most surprising – how forest income has increased for wealthy households in Budongo (partially due to price increases)