Crosstabs
This analysis investigates the relationships between national pride, feelings of alienation, and political participation in Russia. It examines how alienation may increase political engagement while national pride may lead to less participation. The dependent variable, political participation, consists of various activities measured through a series of questions. Crosstab analysis is employed to explore the interaction effects, and relevant statistical techniques are outlined for effective data organization and interpretation. Correlations between variables are visualized using scatter plots.


Crosstabs
E N D
Presentation Transcript
Types of relationships • Linear • Spurious • Intervening • Interaction effects • Suppression
Theory: National pride (alienation) • When people feel alienated from the political system, then they may be more likely to participate in politics. • When people feel national pride in the political system, then they may be less likely to participate in politics. • Measure: • How often do you feel ashamed of Russia? very often, rather often, not very often, hardly ever
Dependent variable: political participation • People either participate or they do not. • There are 31 questions about different political activities. • How should this variable be measured?
Measure of political participation freq vars = polpartbes2.
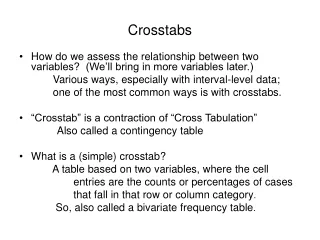
Crosstabs analysis • Like a frequency table, it reports how many and what percentage fall into a particular category, but for two variables instead of one • Not suitable for continuous variables; only for discretely measured variables • It is sometimes useful to recode a variable with too many categories FOR THE PURPOSES OF ILLUSTRATION ONLY
Conventions • the independent variable is arranged across the top of the table • Percentages should be calculated using COLUMN • Syntax: crosstabs tables DV by IV /cells = coll.
Creating collapsed variables • compute polpartbesc = polpartbes. • if polpartbes > 1 polpartbesc = 2.
Syntax: missing and crosstabs • Some useful syntax: • missing values ashamerus (7,8,9). • crosstabs tables = polpartbesc by ashamerus/cells = col/stats = corr.
Syntax for scatter plot GRAPH /SCATTERPLOT(BIVAR)=ashamerus WITH polpartbes /MISSING=LISTWISE. Notice that there is no need for extra categorization – so we used polpartbes, not polpartbesc.