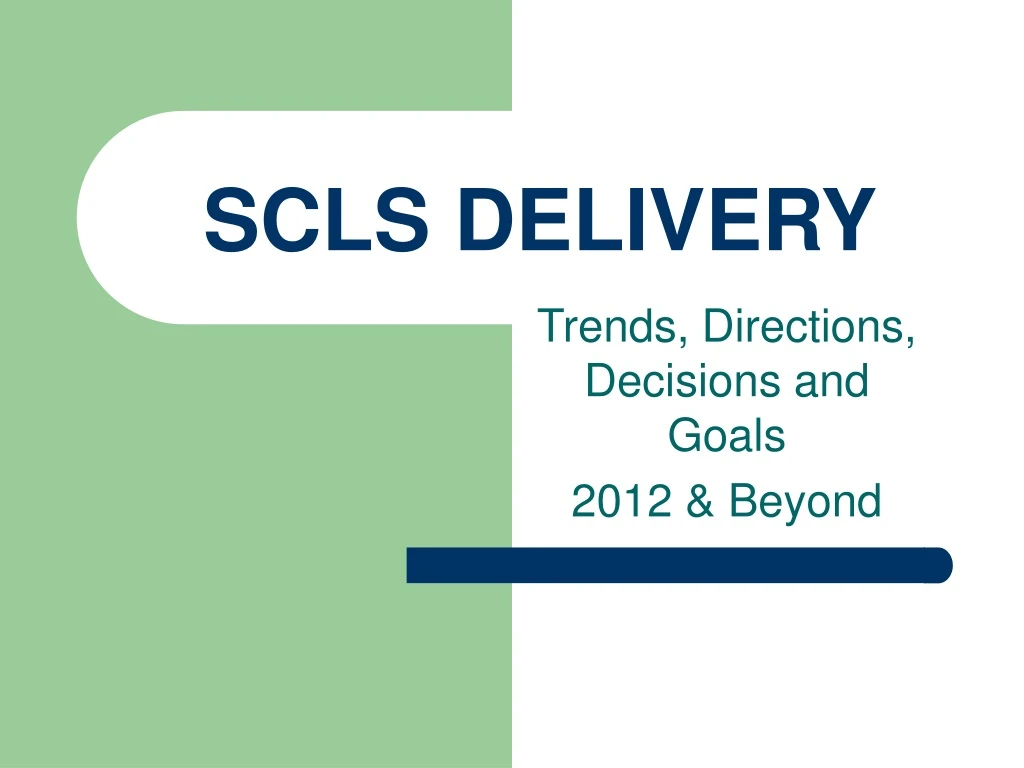

SCLS DELIVERY
E N D
Presentation Transcript
SCLS DELIVERY Trends, Directions, Decisions and Goals 2012 & Beyond
ITEMS PER BASKET 2002 = 34.37 2011 = 41.06
THE COMPETITION • Amazon - 1995 • Netflix - 1999 • iTunes - 2001
I DO WHAT HOW? • Play, Stop, Pause • Download, Save, Export
DELIVERY VOLUME • 1994 to 2008 delivery volume grew nearly 700% • 42 straight delivery volume samples showing growth. • In our last 8 counts, we’ve seen a volume drop in 6 of them. • 2009-2011 delivery volume has dropped about 5%-6%
THE HANDLING CHAIN • Shelf Transit Patron • Patron Transit Shelf • Libraries: process 20,000 incoming items • Delivery: sort 20,000 items picked up • Libraries: prepare 20,000 items for next day’s delivery • 60,000 items x 1 sec. = 16 labor hours
THERE’S SOMEONE ELSE • Shared route costs • Shared overhead costs • Most PL Systems going to 4-day • UW planning to stay at 5-day • Expect changes to happen over many years
WHAT COULD BE NEXT? • Reduced Saturdays • Reduced 2nd daily deliveries to larger Dane libraries • Reduced Frequency M-F
COSTS • Increases in fuel, health insurance rates, facility, vehicle and liability insurances Balanced by • Employee contributions to health insurance and retirement, and staffing changes