CCSSE
CCSSE. Houston Community College System Presented by Margaret Drain June 19, 2007. Administration Tips. Notify Deans and Faculty via eNews and CCSSE letter. Send in a real clean Sample Plan. If you want to drill down by campus, ask for stratified sample.

CCSSE
E N D
Presentation Transcript
CCSSE Houston Community College System Presented by Margaret Drain June 19, 2007
Administration Tips • Notify Deans and Faculty via eNews and CCSSE letter. • Send in a real clean Sample Plan. • If you want to drill down by campus, ask for stratified sample. • Hound the Deans for completion and keep track of CCSSE returns
Here Comes the Data!!!! • Separate Files for Different Analyses – Part 1 • Use Original Unadulterated Primary File for Respondent Reporting • Use Primary and Oversample to Drill Down by Respondent Characteristics • For both of the above weight by CCSSE’s iweight = 'Inst. weight based on part-time/full-time enrollment‘ if assessing perceptual questions to generalize to entire college system.
Here Comes the Data!!!! • Separate Files for Different Analyses – Part 2 • Use Primary and Oversample to Drill Down by Campus Location • Even with Stratification Likely to Require Multiple Data File Adjustments * Excluding Sparsely Answered Questionnaires [In Spring 2005 file there were 143 perceptual questions. Respondent questionnaires with 50 or more missing items were eliminated from the analysis.] * Impute Means for Perceptual Questions [Determine and Insert college means for non-demographic ordinal variables - may limit to just those factor questions used for benchmarking or all perceptuals.] * Determine Weights Needed for Campus Benchmark Scores [Compare & Xtab demographics of sample and population, then derive weight.]
CCSSE 2006 Houston Community College System Spring 2006 Survey results
Using Results • To inform decision making • To target institutional improvement
Participating population • Credit classes were randomly selected • 1,216 students submitted usable surveys • 58% reported attending HCCS full time • 19% indicated international/foreign student status
Findings from CCSSE • Profile students • Answer questions pertaining to student goals, persistence, student engagement, satisfaction with support services • Identify issues
Profiling our students • 60% are female • 61% are age 22-39 • 69% are part-timers • 44%-48% are first generation • 40% have limited English speaking skills • 22% have earned 15-29 credits • 20% have attained an Associate degree or higher
Rating student services • Services our students most often use, express satisfaction with, and rate as important are computer labs and academic advising/planning
Rating student services • Among the least used and least important services are job placement, child care, and services to students with disabilities, according to survey respondents
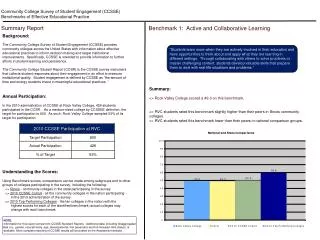
HCCS uses the 5 CCSSE benchmarks for effective educational practice as Key Performance Indicators Active and Collaborative Learning Student Effort Academic Challenge Student-Faculty Interaction Support for Learners Benchmarking performance
Scoring high in 2006 • HCCS exceeded benchmark scores of its peer institutions on all 5 benchmarks • HCCS exceeded its own benchmarks for the previous year and met KPI targets set for 2006
Preparedtwo or more drafts of a paper or assignment before turning it in — Used email to communicate with an instructor— Answering questions What is the frequency of students who often/very often Tutored or taught other students — 10% 55% 46%
Identifying issues • Active and collaborative learning is our lowest benchmark score Focus groups can examine closely how students responded to specific survey items that assess how much they are involved in their education and have opportunities to think about and apply what they have learned in different settings.
Improving student success The Office of Institutional Research supports institutional decision-making, planning, and reporting. We hope that this presentation and our printed publication CCSSEE 2006 will benefit you in your continued efforts to improve student success. Using results improves student success


![CCSSE 2013 Findings for [College Name]](https://cdn1.slideserve.com/2631776/slide1-dt.jpg)