Projections
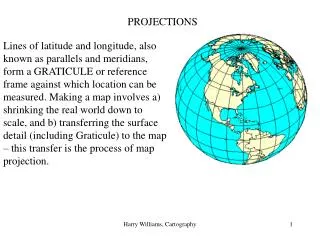
Projections. Review. The Earth is a complex shape called a geoid Ellipsoids are models that approximate the shape of the Earth Ellipsoids are used in place of the geoid because they are much simpler mathematically Datums link the geoid (real shape) to the ellipsoid (modeled shape).

Projections
E N D
Presentation Transcript
Review • The Earth is a complex shape called a geoid • Ellipsoids are models that approximate the shape of the Earth • Ellipsoids are used in place of the geoid because they are much simpler mathematically • Datums link the geoid (real shape) to the ellipsoid (modeled shape)
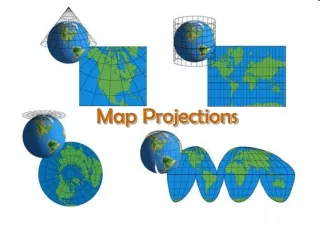
Map Projections • The systematic transformation of points on the Earth’s surface to corresponding points on a plane surface • In other words: Translating the Earth (3D) to a flat map (2D) • All projections distort the Earth in one or more way(s) • Selection of a projection is done to minimize distortion for the particular application
Why do we need a projection? • Creating maps • we must choose an appropriate projection for the map to communicate effectively • part of good cartographic design • Analyzing geographic data • along with the datum (and the associated ellipsoid) and the coordinate system we must know the map projection in which the data are stored • identical projections are required for data to overlay correctly
Common types of projections (a) Azimuthal (b) Cylindrical (c) Conic
Cylindrical projections You cut the cylinder along any meridian and unroll it to produce your base map. The meridian opposite the cut is called the central meridian (the red line). (ESRI Press.)
Cylindrical projections (Cont.) The light source's origin for the map projection is also the origin of the spherical coordinate system, so simply extending the degree lines until they reach the cylinder creates the map projection. The poles cannot be displayed on the map projection because the projected 90 degree latitude will never contact the cylinder. (ESRI Press)
Standard Lines and Points • Location(s) on a projected map at the exact point or line where the surface (cylinder, cone, plane) touches the globe • Standard lines and points are free of all distortion • Distortion becomes more pronounced with increased distance from the standard line or point
Additional Projection Features • Projections get a lot more complicated because we can: • 1) Change the aspect • 2) Move the light source • 3) Change where the paper touches the globe
Projection Aspects cylindrical conical planar
Light source options • Orthographic (light source infinitely far away – think of the sun) • Stereographic (the point opposite of the point of tangency of the projection) • Vertical (how the earth would look from space) • Gnomonic (center of earth)
Change where the paper touches the globe • Tangent case – the paper rests against the surface of the globe • Secant case – the paper goes into and back out of the globe (intersecting at 2 standard lines) Standard line Standard line Standard line
Preservation of Properties • Map projections always introduce some sort of distortion. How to deal with it? • Choose a map projection that preserves the globe properties appropriate for the application • Note: The preservation of properties offers an alternative -- perhaps more meaningful -- way to categorize projections
Map projections distortion Projections cause distortion. The projection process will distort one or more of the four spatial properties listed below. Distortion of these spatial properties is inherent in any map. Shape Area Distance Direction
Preservation of properties Conformal projections • -preserve shape • shape preserved for local (small) areas (angular relationships are preserved at each point) • sacrifices preservation of area away from standard point/lines Equivalent/Equal-Area projections • -preserve area • all areas are correctly sized relative to one another • sacrifices preservation of shape away from standard point/lines
Equidistant projections • -preserve distance • scale is correct from one to all other points on the map, or along all meridians • however, between other points on map, scale is incorrect Azimuthal projections • -preserve direction • azimuths (lines of true direction) from the center point of the projection to all other points are correct
Map Projections Commonly Used For GIS Applications • Mercator: True compass directions are maintained (lines of latitude and longitude are at right angles to each other), but area is distorted toward the poles • This is a cylindrical projection • We often use Universal Transverse Mercator (UTM), which is a coordinate system applied to a Mercator projection
Map Projections Commonly Used For GIS Applications • In the US these are also common projections • Lambert Conformal Conic – a conic projection that preserves shape • Albers Equal Area – a conic projection that preserves area • Remember that these projections (including UTM) can be associated with the same datum (e.g., NAD 1983, NAD 1927, etc.), which is in turn associated with a corresponding ellipsoid (e.g., NAD 1983 uses the GRS 1980 ellipsoid)
Tissot’s Indicatrix The Tissot indicatrix is a figure that shows how a projection changes the geometry. It does so in a simple manner: by showing what a circle would look like on the map. This is an equal area projection. Blue circles are the projected circles (here, ellipses). Grey circles are reference circles. Radii are for reference regarding distance distortion.
Area scale • An indicator of distortion on projected maps. • s = "area scale" = product of semi-axes of circle/ellipse.
Examples of projections • Do the following examples clear up some myths we have grown to believe?
Equidistant example Azimuthal Equidistant projection - planar with standard point centered on North Korea
True Direction & Distance Gnomonic - planar with standard point located at NYC ...compare with Mercator projection:
Compromise projections • ...don’t preserve any properties completely, but achieve compromise between them Example: Robinson projection - designed for world maps
Wrap-Up • Projections are a large and complicated topic to study • There are many more that we didn’t talk about • In practice, we generally stick with just a few common ones (e.g., whatever one our office typically uses) • Only when a new and different task comes up do we start to investigate IF a different projection is needed and WHAT that projection should be • If you’re still curious about them, this is a pretty good site • http://www.progonos.com/furuti/MapProj/
Odds and ends • What night is good for an open lab? • Openings Monday, Tuesday, Wednesday