1 / 6

Understanding Density through Graphing and Slope Calculation

Learn about density as mass per volume, explore slope calculation, and graph data effectively with guidelines. Watch Led Zeppelin's "Density" performance and helium balloons video, then practice graphing liquid A's density. Get ready to ace your density labs!

paloma
Télécharger la présentation

Understanding Density through Graphing and Slope Calculation

An Image/Link below is provided (as is) to download presentation Download Policy: Content on the Website is provided to you AS IS for your information and personal use and may not be sold / licensed / shared on other websites without getting consent from its author. Content is provided to you AS IS for your information and personal use only. Download presentation by click this link. While downloading, if for some reason you are not able to download a presentation, the publisher may have deleted the file from their server. During download, if you can't get a presentation, the file might be deleted by the publisher.

E N D

Presentation Transcript


  1. Density by slope

  2. DENSITY Review: Density = Mass / Volume

  3. Led Zeppelin • http://www.youtube.com/watch?v=7viNdrq8qt0

  4. Helium balloons

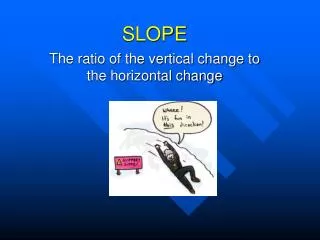
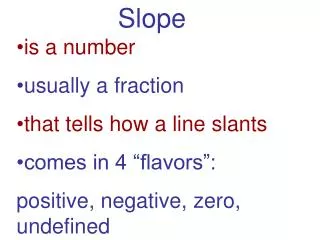
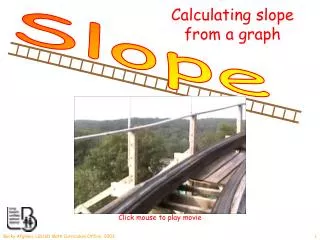
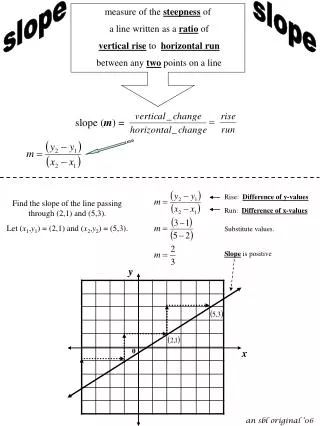
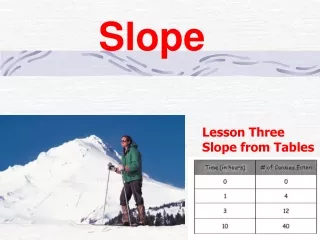
  5. Slope • Rise over Run • http://www.sonic.net/~geco/math/SlopeRiseRun.html http://math.about.com/library/slopeline.pdf

  6. Graphing our data! • Passing out a piece of graph paper to each one of you • Follow along with the graphing guidelines packet and graph the example problem on one side. • Then we will graph the density of liquid A from our past density lab. • The graph liquid A’s density will be collected and graded

More Related