Download
1 / 52
520 likes | 534 Vues
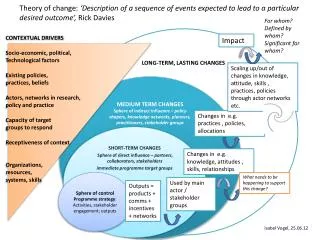
Explore past sea level changes, possible future predictions, impacts, and implications for coastal regions. Learn about data sets, monitoring efforts, and potential rise scenarios. Gain insights into global and regional variations. Stay informed on ongoing monitoring programs.

E N D
Long Term Sea and Land Level Changes and their Monitoring Philip L. Woodworth Permanent Service for Mean Sea Level Proudman Oceanographic Laboratory psmsl@pol.ac.uk
Contents • Questions & Answers on How Sea and Land Levels have Changed • Brief Review of Possible Impacts of Sea Level Change • Long Term Sea Level Change Data Sets and their Deficiencies • What We Must Do: The GLOSS Programme
Questions and Answers about Past and Possible Future Sea Level Changes Q. Has global sea level always been changing ? A. Yes. Sea level has changed by over 120 m during the last 20,000 years, sometimes changing at a rate 10 * faster than the presently-observed rate of change.
Questions and Answers • Q. Has global sea level risen during the 20th • century ? • Yes. By 10-20 cm. • There are many references, see the IPCC Third Assessment Report for a review
20th Century Sea Level Rise Estimates Region, VLM Rate ± s.e. (mm/yr) Gornitz and Lebedeff (1987) Global, Geological 1.2 + 0.3 Peltier and Tushingham (1989, 1991) Global, ICE-3G/M1 2.4 + 0.9c Trupin and Wahr (1990) Global, ICE-3G/M1 1.7 + 0.13 Nakiboglu and Lambeck (1991) Global decomposition 1.2 + 0.4 Shennan and Woodworth (1992) NW Europe, Geological 1.0 + 0.15 Gornitz (1995)d NA E Coast, Geological 1.5 + 0.7c Mitrovica and Davis (1995), Davis and Mitrovica (1996) Far field, PGR Model 1.4 + 0.4c Davis and Mitrovica (1996) NA E Coast, PGR Model 1.5 + 0.3c Peltier (1996) NA E Coast, ICE-4G/M2 1.9 + 0.6c Peltier and Jiang (1997) NA E Coast, Geological 2.0 + 0.6c Peltier and Jiang (1997) Global, ICE-4G/M2 1.8 + 0.6c Douglas (1997)d Global ICE-3G/M1 1.8 + 0.1 Lambeck et al. (1998) Fennoscandia, PGR Model 1.1 + 0.2 Woodworth et al. (1999) UK & N Sea, Geological 1.0 + 0.2 N.B. All these analyses use the same PSMSL data set
Questions and Answers Q. Do we understand why it has risen? A. Yes. (More or less)
Why has sea level risen? Main driver has been the 0.6 º global temperature change during the past century, but there have been many contributors to the sea level change (numbers are approximate in cm): Thermal expansion (5), Glaciers/ice caps (3), Greenland (0.5), Antarctica (-1), Ice sheets ongoing since last glacial max. (2.5), Permafrost (0.3), Sediment deposition (0.3), Terrestrial storage (-3.5) ……. (See IPCC TAR for a review)
Questions and Answers • Q. Is the rate of rise increasing ? • A. No. On basis of 20th century tide gauge data alone. • Yes. On basis of study of long records spanning 18th to 20th centuries. • A. Possibly. On basis of comparison of rate measured during the1990s by altimetry to 20th century rate from tide gauges (i.e approx. 3 mm/year compared to 1-2 mm/year)
Sea level change contains an acceleration of sea level rise from the 19th to the 20th centuries due to climate change
Questions and answers • Q. How much might sea level rise in the 21st century? • 9-88 cm with central value of 48 cm based on 35 emission scenarios and 7 AOGCMs (IPCC Third Report). • Predictions are relatively insensitive to emission scenarios over next few decades. N.B. rises will not be the same in all parts of the world because of the readjustment of the ocean circulation to climate changes.
Changes in Sea Level in the Next 100 Years • Next 100 years • a rise between 9 and 88 cm • a central value of 48 cm • a rate of approx. 2.2 - 4.4 • times that of the past • 100 years (IPCC TAR) • BUT RISE WILL NOT BE THE SAME EVERYWHERE • DUE TO CHANGES IN OCEAN CIRCULATION Projected sea level rise, IPCC 2001
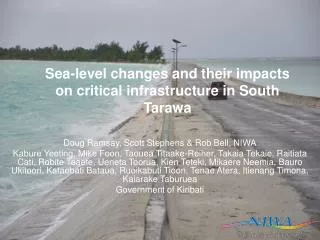
Questions and Answers Q. How important will the 21st century changes be? A. When MSL (or water depth) changes, and when also there are coupled changes in regional meteorology, there will be changes in storm surges, tides, waves and extreme water levels. A. Also there will be impacts on environmental and socio-economic infrastructure at the coast.
Return period of surge heights at Immingham (England) There will be a reduction in the return period of extreme events.
Coastal areas at risk • Areas below 1000-year return period level • By 2100: the 1 in 1000 year flood level (shown here in red) may become a 1 in 100 year level
Coastal Squeeze(of coastal wetlands) “Slow” Sea-Level Rise (a) natural situation (b) hard defences
Sea level rise during the 20th century has had regional impacts. Marsh Destruction at Blackwater, Maryland, Due to Sea Level Rise Leatherman, 2001
Projected Coastal Megacities: 2010 (>8 million inhabitants) Tianjin Dhaka Seoul Osaka Istanbul Tokyo New York Shanghai Los Angeles Manila Bangkok Lagos Bombay Lima Karachi Madras Jakarta Rio de Janeiro Buenos Aires Calcutta
Questions and Answers Q. Will sea level continue rising beyond the 21st century? A. Yes, it will continue rising for 100s of years. This is called the Sea Level Commitment i.e. a continued rising sea level as the lower levels of the ocean warm.
Sea Level Commitment • Scenarios of long term sea level change beyond the 21st century (from IPCC). • Rises of 1-4 m might be expected over several 100 years.
Conclusions of Questions & Answers • Sea level has always been changing since the last interglacial (120,000 years BP) • Sea level has risen during the last century • Sea level may rise more during the next 100 years • So we have to measure sea level change as well as we can and try to understand why it changes • National, Regional and Global Sea Level Monitoring Programmes.
National Sea Level Networks • UK Tide Gauge Network contributes data to the Permanent Service for Mean Sea Level (PSMSL) and to the GLOSS programme
National Sea Level Networks • Chile Tide Gauge Network • Another example of a network which contributes data to the PSMSL and GLOSS
Permanent Service for Mean Sea Level Most tide gauge agencies regularly send their monthly and annual Mean Sea Level (MSL) data to the PSMSL. Founded in 1933 by International Council for Science. Data set contains 50,000 station-years of MSL data. The PSMSL is more than a data bank. It attempts to provide an overall Service to the sea level community.
MSL Changes in Last 100 Years • Past 100 years • Most PSMSL records show evidence for rising sea levels during the past century • IPCC Third Assessment Report concluded that there has been a global rise of approximately 10-20 cm during the past 100 years
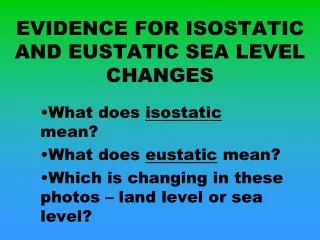
There are Two Main Problems with the Present ‘Global’ Sea Level Data Set • ‘Sea Level’ measurements are relative to land level. SOLUTIONMeasure Land Levels using new geodetic techniques such as GPS and Absolute Gravity
Land Movements can be: • Slow and monotonic e.g. Glacial Isostatic Adjustment (Post Glacial Rebound) • or • Fast and irregular e.g. tectonics in Chile, Alaska etc. • Geodynamic models of the solid Earth exist only for GIA and even they are not perfect.
Land movements seen in tide gauge records due to: GIA/PGR Earthquake Ground-water pumping Harbour development/ Sedimentation For comparison: Hot spot (normal?)
GIA models for VLM corrections Peltier ICE-4G GIA model N.B. There is nowhere on Earth which does not experience some effect of GIA
Tools for Measuring Land Level Changes GPS Absolute Gravity Geology
GPS Networks (UK) • The current network • of UK GPS receivers • which monitor vertical • and horizontal land • movements. • (Operated by the • University of • Nottingham with POL.)
GPS Networks (USA and Canada) GPS and tide gauge data to constrain glacial isostatic adjustment in the USA and Canada UNAVCO, 2003 (http://www.unavco.org/research_science/brochure/brochure.html)
Geological Data used to estimate land movements (mostly GIA in the UK) • Geological data can be used to estimate vertical land movements (Shennan, 1989 estimates shown here, in mm/yr) • Land subsidence/uplift can result from: • GIA (PGR) • water extraction • sediment compaction • earthquakes etc. Of these processes only GIA can be modelled.
There are Two Main Problems with the Present ‘Global’ Sea Level Data Set • Uneven geographical distribution: the PSMSL data set is under-represented in Africa, Antarctica etc. and there are no long term records from the deep ocean. SOLUTIONSIOC GLOSS programme to densify the existing tide gauge network, and programmes of satellite altimetry to measure sea levels from space. Also some deep ocean measurements.
Complementary Tools for Measuring Sea Level Changes Tide Gauges Satellite Altimetry Sea Floor Systems
The GLOSS Programme • GLOSS Core Network (GCN) • Regional Densifications • of the GCN • Long Term Trends (LLT) • Altimeter calibration • (GLOSS-ALT set) • Ocean Circulation • (GLOSS-OC set) GLOSS Core Network (GCN) with approx. 300 stations http://www.pol.ac.uk/psmsl/programmes/gloss.info.html
Why Are GLOSS Tide Gauges Needed in the “Age of Altimetry”? • Altimeters need to be calibrated using gauges • Principle of continuity and relative low cost of • gauges. The altimeter record may have gaps in the future and we may need to fall back on GLOSS gauges for global data • Long gauge records are needed for secular trend/acceleration studies (e.g. for IPCC) • Higher frequency sampling important in straits • and other areas e.g. Drake Passage • High latitude regions of ice coverage • Many coastal applications. People live at the coast and not in the deep ocean. Acoustic Gauge in Australia
Southern Ocean sea levels are hard to monitor with altimetry gauges are essential.
To summarise, we need to be able to: • Monitor sea and land level changes using in situ devices including tide gauges and GPS • And monitor sea level changes from space using altimetry • Then, when we have good data, we will have a chance to model (understand) why sea and land levels are changing. This need not be very expensive as gauges (and other equipment) are anyway needed for practical as well as scientific purposes.
Other Reasons to Measure Sea Levels • Coastal management requires understanding of past and future changes in sea level and related ocean conditions • Practical applications – e.g. to predict flood risks, coastal • navigation etc. • There are Many Different Time-Scales of Sea Level Change, not all Long Term, e.g. • Tsunamis • Tides, storm surges and extremes • Seasonal changes • Interannual changes e.g. due to ENSO • So Countries need Gauges for many Reasons other than ‘Climate’ or ‘Science’ Maldives Int. Airport