Download
1 / 8
80 likes | 116 Vues
Explore the vast potential of converting wet wastes, FOGs, MSW, agro & forestry residues, and industrial gases into jet fuel to meet a significant portion of the U.S. demand. Detailed analysis and sources included.

E N D
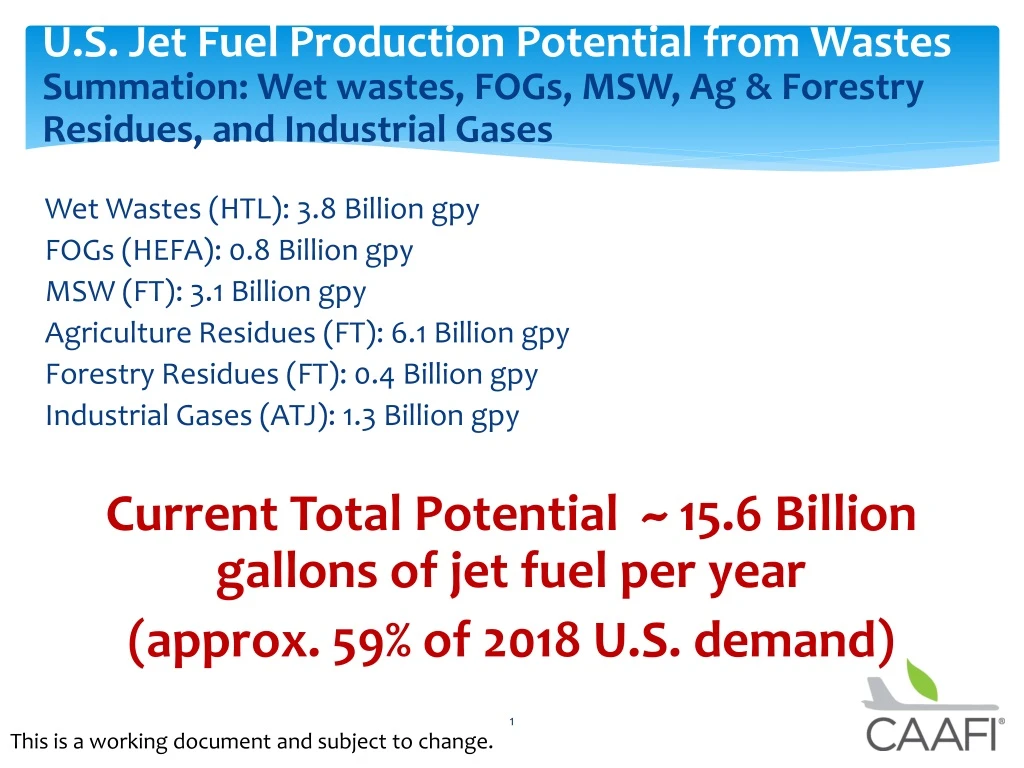
U.S. Jet Fuel Production Potential from WastesSummation: Wet wastes, FOGs, MSW, Ag & Forestry Residues, and Industrial Gases Wet Wastes (HTL): 3.8 Billion gpy FOGs (HEFA): 0.8 Billion gpy MSW (FT): 3.1 Billion gpy Agriculture Residues (FT): 6.1 Billion gpy Forestry Residues (FT): 0.4 Billion gpy Industrial Gases (ATJ): 1.3 Billion gpy Current Total Potential ~ 15.6 Billion gallons of jet fuel per year (approx. 59% of 2018 U.S. demand) This is a working document and subject to change.
U.S. Jet Fuel Production Potential from WastesWet Wastes – converted, e.g., via HTL 3.8 B gpy* • Animal manure - 2.7 B gpy • Wastewater sludge - 1.1 B gpy *Removed FOGs and Food Waste from jet fuel calculation – FOGS assumed to go to HEFA and food waste to MSW/FT Assumes a nearly 100% conversion rate from biocrude to jet fuel Source: Waste-to-Energy biofuel production potential for selected feedstocks in conterminous United States, Skaggs, et al.
U.S. Jet Fuel Production Potential from WastesFOGs– converted, e.g., via HEFA 823 M gpy* (estimates vary) • Inedible fats, oils, and greases (FOGs) (5.92M short tons/y) https://www.nrel.gov/docs/fy18osti/68470.pdf https://fred.stlouisfed.org/series/M01218USM149NNBR
U.S. Jet Fuel Production Potential from WastesMSW – converted, e.g., via FT 3.1B gpy • 137.7 million tons sent to landfill in 2015 *Assumes all landfilled wastes are recovered and utilized
U.S. Jet Fuel Production Potential from WastesAgricultural Residues – converted , e.g., via FT or ATJ 6.1B gpy • Corn, wheat and soy 90% of cropland • USDA 2019/2020 Projections for domestic production: • Corn 14,930 million bushels • Wheat 2,060 million bushels • Soy 4,090 million bushels
U.S. Jet Fuel Production Potential from WastesForestry Residues – converted, e.g., via FT 381M gpy • 70% of residues already diverted • Total Unused Recoverable Residues = 15,334.362 thousand short tons https://www.fs.fed.us/sites/default/files/media/types/publication/field_pdf/GTR-WO-91.pdf
U.S. Jet Fuel Production Potential from WastesIndustrial Gases – converted, e.g., via gas fermentation followed by ATJ 1.3B gpy* • SteelMills - 820M gpy • Ferro-Alloy – 20M gpy • Refineries – 500M gpy Fossil Fuel Power Plants in the U.S. Two most prominent sources are coal (black) and natural gas (orange) https://www.visualcapitalist.com/mapped-every-power-plant-in-the-united-states/ https://www.ft.com/content/52552bf8-c024-11e9-89e2-41e555e96722 * Communication with Dave Meyer, LanzaTech, August 5, 2019 https://venturebeat.com/2012/01/23/lanzatech-raises-55m/
For additional detail, please contact us at info@caafi.org This is a working document and subject to change.


