Download
1 / 13
130 likes | 147 Vues
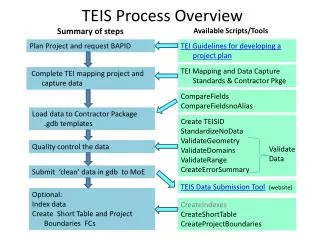
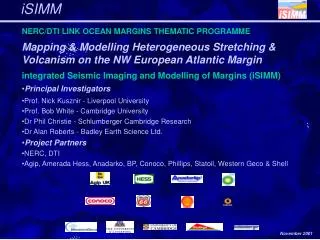
Study of TEI and particle transport at ocean margins with intense lateral fluxes. Ideal for elemental scavenging studies and GEOTRACES sections. Includes detailed hydrographic surveys, moorings, and biogeochemical flux studies along Line W. Proposal program until 2013. Visit the website for more information.

E N D
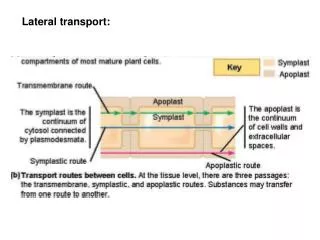
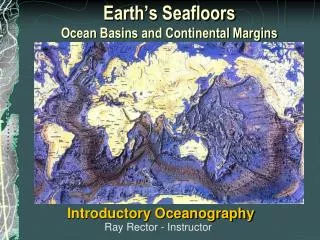
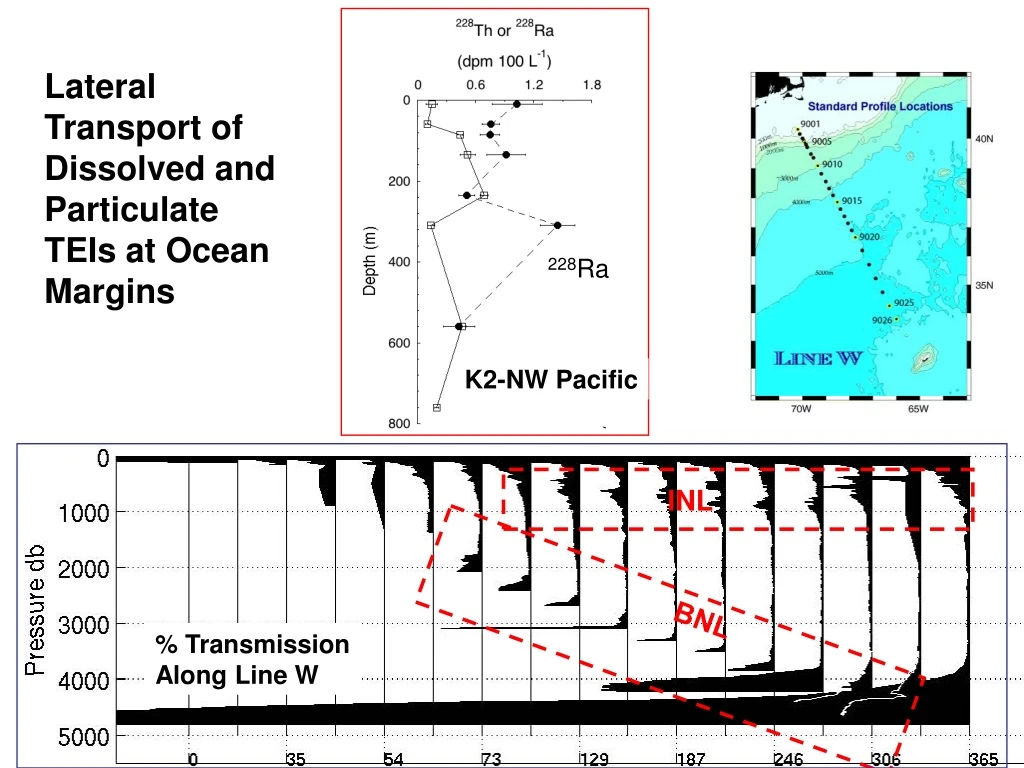
Lateral Transport of Dissolved and Particulate TEIs at Ocean Margins 228Ra K2-NW Pacific INL BNL % Transmission Along Line W
Attributes of Line W as a GEOTRACES section • Detailed hydrographic template within which to interpret geochemical profiles (proposed PO program to run until 2013). • Frequency of cruises between Woods Hole and Bermuda facilitate re-occupation of stations along transect (Process studies? GEOTRACES Intercalibration Station?). • Intersects with planned ORION/IOOS PIONEER program designed to characterize shelf-slope processes on NW Atlantic margin. • Intersects major components of MOC (DWBC and Gulf Stream). • Sharp, well-defined contrasts in water mass source/age/history. • High productivity margin. • Significant and distinct lateral particle fluxes in intermediate and bottom nepheloid layers. • Prior and on-going sediment trap studies. • Ideal for studies of elemental boundary scavenging. • Potential western limb of an east-west transatlantic GEOTRACES section that interests major particle flux time-series stations. http://www.whoi.edu/science/PO/linew/index.htm
PIONEER Array, Line W, and the Northeast Regional Coastal Ocean Observing System Current Boundary Pioneer Western Array Deep Line W
On-going and planned physical oceanographic measurements along Line W (J. Toole et al.) • Moorings: • Fixed instruments (moorings 2,4,6) • T/C sensors • Vector averaging current meters (VACMs) • Moored Profilers (MMPs, moorings 1,3,5) • - CTD • - ADCP • Optical backscatter • Transmissometry (proposed) 1 2 3 4 5 6 Hydrographic survey cruises: - CTD - Nutrients - Dissolved O2 - I-129 - CFCs/SF6 - Optical backscatter + transmissometry
Composite mean property sections (1995 and 2006) along Line W. Average, net southward DWBC transport across Line W is estimated to be 16 Sv. (Joyce et al., 2005)
Recent and proposed biogeochemical flux studies on Line W Sediment traps
The Northwest Atlantic Margin is characterized by high mass fluxes! Line W (mooring @ 3000 m isobath) Global variations in mass fluxes for particles intercepted by sediment traps deployed within or below the mesopelagic zone
Line W Mooring deployment timelines (past and proposed) Spring 2004 Spring 2005 Spring 2006 Spring 2007 Spring 2008 Spring 2009 Spring 2010 Spring 2011 Spring 2012 Spring 2013 Possible 3000 m Trap mooring WHOI funded Proposed WHOI funded NSF-CO funded NSF-CO funded Proposed Proposed Possible 2000 m Trap mooring WHOI funded Proposed Proposed 4700 m Trap mooring PO moorings Toole proposal Toole proposal Toole proposal Toole proposal Toole proposal NSF-PO funded NSF-PO funded NSF-PO funded NSF-PO funded
An E-W transatlantic GEOTRACES section? Line W ESTOC Bermuda OFP
Line W PO measurement program consists of a moored array spanning the continental slope plus annual/semi-annual (spring and fall) hydrographic survey cruises http://www.whoi.edu/science/PO/linew/index.htm
The NW Atlantic Margin: A Productive, dynamic and spatially heterogenous system Three-day composite satellite SST (left) and chlorophyll concentration (right) for 18-20 June 2001.
Turbidity sensor measurements from MMP deployed at 3000 m (Station W) Jan 30, 2005