Download
1 / 1
10 likes | 122 Vues
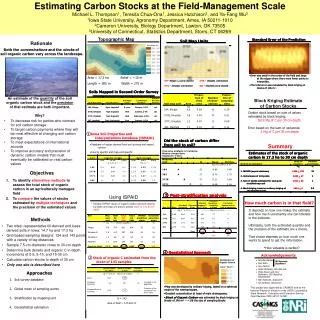
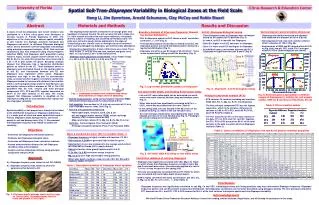
a. b. Shallow. g s. 152. g s. 94. Deep. Flooded. Non-flooded. Leaf stomatal conductance (g s ). Water table depth (m). Shallow. Medium. Deep. University of Florida. Citrus Research & Education Center. Spatial Soil-Tree- Diaprepes Variability in Biological Zones at the Field Scale

E N D
a b Shallow gs 152 gs 94 Deep Flooded Non-flooded Leaf stomatal conductance (gs) Water table depth (m) Shallow Medium Deep University of Florida Citrus Research & Education Center Spatial Soil-Tree-Diaprepes Variability in Biological Zones at the Field Scale Hong Li, Jim Syvertsen, Arnold Schumann, Clay McCoy and Robin Stuart Abstract Materials and Methods Results and Discussion • A study of soil-tree-Diaprepes root weevilrelations was conducted in a 9.5-ha citrus grove near Southport in Osceola County in Florida beginning in 2002. The objectives of the study were to assess spatial variability of soil, ‘hamlin’ tree (Swingle citrumelo rootstock) and Diaprepes root weevil, to delineate Diaprepes biological zones, and to determine soil-tree-Diaprepes relationships using principal component analysis (PCA). Soil electrical conductivity (EC) was measured using electro-magnetic induction EM38, and Diaprepes adult population (using Tedder’s traps), soil pH, organic matter content, P, K, Ca, Mg, B, Zn, Fe, Cu, and other properties were measured in a 35 x 25 m grid across the grove. Boundary analysis showed that Diaprepes had a log-normal distribution pattern as related to soil EC. Three biological zones of Diaprepes were delineated based on the spatial patterns of soil EC, and correlations between soil EC and Diaprepes were significant within zones. Diaprepes frequency was high in low Mg and Ca concentration areas, as shown by their negative correlation coefficients. Diaprepes tended to increase with distance then stabilize within a semivariogram range of 200 m. Soil Mg had a low and similar variance within a distance of 100 m. The PCA quantified that the first, second and third principal components (PC1, PC2 and PC3) together accounted for 80.4% of the total variance in the data. The results suggest that Diaprepes variabilityis weighted on the importance of Mg and Ca concentrations that explain soil-tree-Diaprepes variability. • Introduction • Spatial variability of soil properties is thought to be linked to the distribution frequency of Diaprepesabbreviatus (L.), a major pest of citrus and some agricultural crops in Florida. Diaprepes adults damage leaves, and larvae pupate in soil and damage roots (Fig. 1). We assumed that Diaprepes frequency was related to spatial soil variability. • Objectives • Determine soil-Diaprepes distribution patterns • Delineate soil-Diaprepes biological zones • Determine soil-Diaprepes linear correlation relations • Assess autocorrelation distancefor soil-Diaprepes • variables using semivariogram • Analyze soil-tree-Diaprepes relations using principal • component analysis (PCA) • Approach • H0: Diaprepes frequency was related to soil EC (EM 38) • H1: Diaprepes frequency was related to other soil • parameters that determine EC • The ongoing study has been conducted in an orange grove near Southport in Osceola County. The site is nearly flat with a slope of 0-2%. Soils consist of sand muck over clayey materials, very poorly drained, subject to flooding,and classified as Floridana sand. The soils were formed in sandy marine sediments at the edges of Tohopekaliga Lake. ‘Hamlin’ trees on Swingle citrumelo rootstock were severely damaged by Diaprepes, and commercially abandoned. • Infested tree classification: A total of 2244 trees were rated. There • were 4 rates ( 1 to 4) as very bad, bad, medium and good trees. • Rate 1 & 2 account for 63% of the infested trees. • Diaprepes adult population measurement: using Tedder’s traps • (n = 50) in a 35 x 25 m grid in a 5-ha area (Fig. 2). • Boundary Analysis of Diaprepes frequency: Skewed log-normal distribution • Plot of diaprepes against soil EC shows a small correlation coefficient , r = 0.14 (Fig. 3). • The boundary analysis shows that as related to soil EC, the Diaprepes present a skewed distribution pattern similar to a log-normal distribution (Fig. 3). • Diaprepes are within a soil EC range of 20- 60 mS m-1. There is one measurement falling outside the boundary (Fig. 3). • Semivariogram (autocorrelation distances) • Diaprepes distribution increased with distance then stabilized at a distance of 200 m (Fig. 6a). • Soil magnesium had a low and a similar variance within a distance of 100 m (Fig. 6b). • Semivariance of SOM and EC ranged within 50-100 m (Fig. 6ad), and pH, CEC, sand, K & Ca ranged within 50-100 m (semivariograms not shown). • Soil EC-Diaprepes biological zoning • Three biological zones of Diaprepes were delineated based on the spatial soil EC patterns (Fig. 4). • In zone A, soil EC is low with few Diaprepes. • Zone B is higher in soil EC and lower in Diaprepes. • Zone C is lower in soil EC and higher in Diaprepes. • In individual zones, correlations between soil EC & Diaprepes are significant for zone B and C (Fig. 4). Fig. 3. Log-normal distribution pattern of Diaprepes Fig. 4. Diaprepes - soil EC biological zoning • Soil water table depth, soil flooding & leaf water stress • Like soil EC, water table depth can be delineated into north, center and south zones as shallow, deep and medium zones (Fig. 5). • Water table depth was significantly correlated with Fe (r = - 0.28*), which was associated with tree rate (Table 3). • In the spring 2003, soil was flooded in the NE corner of the shallow area (Fig. 5), where is the low elevation area. • Tree leaf stomatal conductance was significantly lower in the flooded area than in the non-flooded area (Fig. 5). Flooding is the critical component in citrus growth. Fig. 2. Diaprepes infested tree locations and rates, and positions of traps and soil sampling Fig. 6. Semivariograms and spatial correlation ranges of Diaprepes (a), soil Mg (b), soil organic matter, SOM (c) & electrical conductivity, EC (d) • Principal component analysis (PCA) • PCA contains 10 variables including soil moisture, SOM, CEC, EC, K, Mg, Ca, B, Zn, H & Diaprepes. • The first principal component PC1 has the highest eigenvalue, which is the variance. Difference in variance is 3.98 for PC1-PC2, and 0.50 PC2-PC3, and 0.76 PC3-PC4 (Table 2). • The PC1 accounts for 50% of the total variance in the data, 17% for PC2, and 13% for PC3. Together, the PC1, PC2 & PC3 account for 80.4% of the total variance in the data to explain soil-tree-Diaprepes relations (Table 2). • Soil EC measurements: using electromagnetic induction EM38 instrument measuringacross the whole block (9.5 ha). • Soil sampling: from surface to 1.2 m at an increment of 0.3 m at each Diaprepes trap on 2 Nov. 2002 (Fig. 2). • Soil (0-0.3 m) parameters measured: • Water table depth, moisture, sand, clay & silt • pH, soil organic matter content (SOM), cation exchange capacity (CEC) & base saturation (BS) • Major and minor cations (P, K, Mg, Ca, B, Zn, Mn, Fe & Cu) • Statistics: Semivariogram, Proc Variogram (SAS) • Principal component analysis (PCA), Proc Princomp (SAS). Table 2. PCA correlation matrix Table 3. Linear correlations of Diaprepes, tree rate & soil physico-chemical properties • Mean & standard deviation (SD) of variables(Table 1) • Diaprepes frequency is highly variable with location: CV 65%. • Soil moisture & SOM are generally high across the grove. • Sand content is very low compared to the average sand content for citrus soil in Florida (94%): poorly drained. • Soil pH is low for citrus growth (optimum pH 6.0-6.5). • P, Zn, Mn, Cu & BS were poor across the grove. • Mg, Ca & Fe were high and variable: liming practices. • Water table depth, moisture, sand, silt, pH, CEC, EC, BS and H: relatively stable, CV 9-33%. Fig. 5. Soil water table & flooding vs. leaf water stress • Correlation relations of soil-tree-Diaprepes • Diaprepes was negatively correlated with CEC, Mg & Ca (Table 3), which shows that Diaprepes frequency is high in lower Mg and Ca concentration areas. Limestone was applied at a rate of 7.4 t ha-1 across the grove in the spring 2002. • Tree rate was negatively correlated with soil Fe (Table 3), which was correlated with water table depth (shown above). • SOM is highly correlated with sand, soil moisture, pH, CEC, EC, K, Mg, Ca, B, Mn, Fe, & H (- 0.40 < r < 0.90) (Table 3). Table 1. Descriptive statistics of Diaprepes & soil variables Conclusions Diaprepes frequency was significantly correlated to soil Mg, Ca and CEC, indicating previous soil liming practices may have determined Diaprepes frequency. Diaprepes frequencypattern and soil EC present a log-normal distribution. Soil-Diaprepes correlations can be better described using biological zoning. The first principal component PC1 accounts for 50%, and PC1, PC2 & PC3 account for 80.4% of the total variance that explain spatial soil-tree-Diaprepes variability. Acknowledgement We thank Florida Citrus Production Research Advisory Council for funding, and Ian Jackson, Angel Hoyte, and Jill Dunlop for assistance in this study. Fig. 1. Diaprepes adults damage leaves and lay eggs on leaves (left). Diaprepes larvae feed on roots and pupate in soil (right).