Download
1 / 19
190 likes | 271 Vues
Learn about downscaling global meteorological predictions for advanced flood prediction systems. Explore a case study on the Mississippi Basin, focusing on data processing, bias correction, and forecast verification techniques.

E N D
DOWNSCALING GLOBAL MEDIUM RANGE METEOROLOGICAL PREDICTIONS FOR FLOOD PREDICTION Nathalie Voisin, Andy W. Wood, Dennis P. Lettenmaier University of Washington, Seattle 3rd HEPEX Workshop, June 27-29, 2007, Stresa Italy
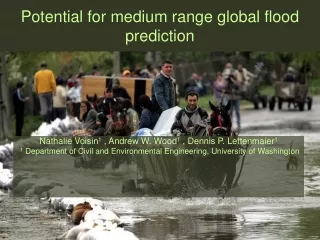
Background Flood prediction systems exist • in developed Countries • What about developing countries? The potential for global flood prediction system exists • Global weather prediction models : analysis and forecasts are available • Practical Issues: mismatch between the spatial resolution of weather and hydrology models ( until recently)
Objectives 1.Objective of the scheme: Predict streamflow and associated hydrologic variables, soil moisture, runoff, evaporation and snow water equivalent : • At a global scale • Spatial consistency • Especially in ungauged or poorly gauged basins • Lead time up to 2 weeks 2. Objective of this talk: Mississippi Basin case study. • Good data to validate and check the scheme • Verification of forecast error statistic predictions resulting from application of the downscaling sequence on the weather forecasts
Outline • The prediction scheme • Processing on the weather forecasts • Bias Correction validation • Forecast verification before and after Bias Correction • Conclusions
1.The global prediction scheme (here in retrospective mode) Several years back, spin up Medium range forecasts (up to 2 weeks) NCEP Reforecasts 15 ensemble members – 15 day forecast – 2.5 degree (fixed GFS version of 1998) Daily ERA-40, surrogate for near real time analysis fields Forecast verification Bias correctionat 2.5 degree, with respect to ERA-40 (Ensures consistency between spinup and the reforecasts) Forecast verification Downscaling to 0.5 degree Downscalingfrom 2.5 to 0.5 degree using the Schaake Shuffle with higher spatial resolution satellite GPCP 1dd and TRMM 3B42 precipitations Atmospheric inputs VIC Hydrology Model Hydrologic model spin up (0.5 degree global simulation) Hydrologic forecast simulation INITIAL STATE (0.5 degree global simulation: stream flow, soil moisture, SWE, runoff ) Nowcasts Several years back Medium range forecasts (up to 2 weeks)
Outline • The prediction scheme • Processing on the weather forecasts • Bias Correction validation • Forecast verification before and after Bias Correction • Conclusions
2. Processing of the weather forecasts Bias correction: Quantile-Quantile technique with respect to ERA-40 climatology • GFS reforecast , 1979-2001 daily CDF for the 15 ensembles, for each lead time, based on time of the year • ERA-40 (Obs) , 1979-2001 daily CDF , based on time of the year • Extreme values: fitted distributions Figure adapted from Wood and Lettenmaier, 2006: A testbed for new seasonal hydrologic forecasting approaches in the western U.S.
2. Processing of the weather forecasts 1979-2001 CDF for the Mississippi basin, daily mean precipitation Mississippi Basin: • ERA-40 usually has lower estimates of precipitation Bias correction(quantile – quantile technique) Annual January July
2. Processing of the weather forecasts Mississippi Basin: Number of days Difference in the number of precipitation events >= 1mm in the 1979-2001 period GFS refcst avg - Obs Annual CDF for Cell (35oN, 102.5oE) Annual CDF for Cell (40oN, 90oE)
Outline • The prediction scheme • Processing on the weather forecasts • Bias Correction validation • Forecast verification before and after Bias Correction • Conclusions
3. Bias Correction Validation Mississippi Basin: Mean and standard deviation, annual daily values Threshold is GFS refcst avg & Obs >= 0mm 8386 events • BC is independent for each lead time: • The mean is flattened for all lead time, long lead time are not wetter than short lead time anymore. • Ensemble standard deviation decreased • Both • correction for intermittency AND • distribution fitting for extreme values add water : BC GFS refcst mean does not match exactly the ERA-40 mean Improvement ?
3. Bias Correction Validation Mississippi Basin: CDF of precipitation forecast MAE • Improvement of the MAE of daily precipitation forecast Non Exceedence probability plot for the precipitation forecast Mean Absolute Error, Mississippi Basin average, daily annual mean
Outline • The prediction scheme • Processing on the weather forecasts • Bias Correction validation • Forecast verification before and after Bias Correction • Conclusions
4. Forecast Verification • Skill maintained or improved? • Ensemble statistics that make sense for an hydrology application ( spread, reliability, mean …)? Validation of skill related statistics: • Bias • RMSE • Rank histogram • Continuous Rank Probability Score (CRPS)
4. Forecast verification Bias for the Mississippi Basin 8386 events >= 0mm Improvement 3212 events >= 1mm 488 events >= 10mm No Improvement
4. Forecast verification RMSE for the Mississippi Basin 8386 events >= 0mm Improvement 3212 events >= 1mm Improvement 488 events >= 10mm
4. Forecast verification Rank histograms for the Mississippi Basin More reliability in the ensemble spread? Improvement NO Improvement NO Improvement 8386 events 3212 events 488 events
4. Forecast verification Continuous Rank Probability Score (CRPS) • Probabilistic weighted average error • Related to the rank histogram and to the mean absolute error • Index for predictability The smaller the CRPS, the better 8386 events >= 0mm Improved predictability 3212 events >= 1mm 488 events >= 10mm
5. Conclusions • Validation of the bias correction : reduced mean errors • Impact of bias correction on forecast verification: • Improved RMSE • Improved intermittency (rank histograms) • No improvement in ensemble reliability, especially with longer lead times (rank histograms) • Improved predictability (CRPS) • Does forecast calibration as a subsequent step improve both reliability AND predictability? Poster: Zambeze and Danube Basins case studies Thank you!