Download
1 / 13
130 likes | 257 Vues
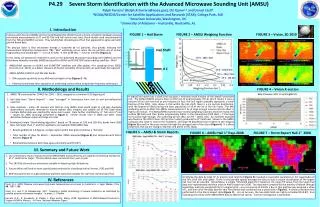
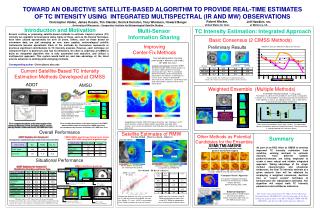
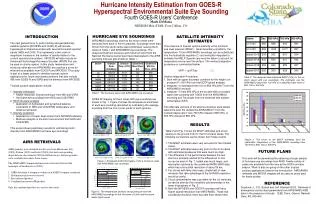
This study presents a refined methodology for estimating tropical cyclone intensity leveraging data from the Advanced Microwave Sounding Unit (AMSU). The algorithm, developed from 1999-2001 and tested in real-time during 2002, utilizes measurements of upper-level warm anomalies and provides reliable maximum wind speeds and minimum sea-level pressure estimates. The results show comparable performance to traditional Dvorak techniques, making AMSU an essential tool for meteorologists in forecasting hurricane intensity and structure.

E N D
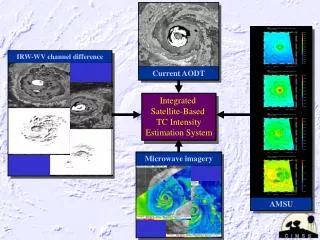
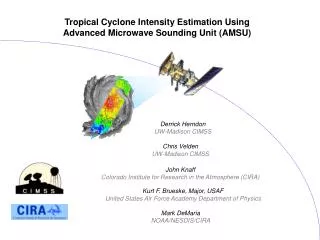
Tropical Cyclone Intensity Estimation Using Advanced Microwave Sounding Unit (AMSU) Derrick Herndon UW-Madison CIMSS Chris Velden UW-Madison CIMSS John Knaff Colorado Institute for Research in the Atmosphere (CIRA) Kurt F. Brueske, Major, USAF United States Air Force Academy Department of Physics Mark DeMaria NOAA/NESDIS/CIRA
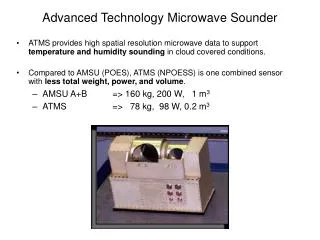
929hPa Tropical Cyclone Intensity Estimation Using NOAA-KLM Series Advanced Microwave Sounding Unit (AMSU) Warm Core Observations • AMSU flown aboard NOAA 15, 16 and 17 as well as Aqua • - 6 estimates per day (2 more with Aqua) • MSLP estimates derived from AMSU-A radiances • - Provides measure of upper level warm anomaly magnitude • - Channels 7 and 8 located at average ht of anomaly (150-250mb) • - Anomaly strength directly related to intensity Hurricane Floyd 1999 Hurricane Inez 1966
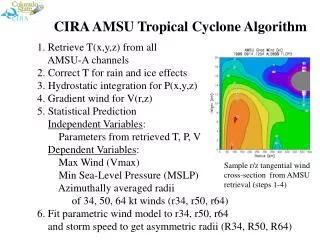
CIRA AMSU Tropical Cyclone Algorithm • 1. Retrieve T(x,y,z) from all • AMSU-A channels • 2. Correct T for rain and ice effects • 3. Hydrostatic integration for P(x,y,z) • 4. Gradient wind for V(r,z) • 5. Statistical Prediction • Independent Variables: • Parameters from retrieved T, P, V • Dependent Variables: • Max Wind (Vmax) • Min Sea-Level Pressure (MSLP) • Azimuthally averaged radii • of 34, 50, 64 kt winds (r34, r50, r64) • 6. Fit parametric wind model to r34, r50, r64 • and storm speed to get asymmetric radii V(r,Q) Sample r/z tangential wind cross-section from AMSU retrieval (steps 1-4)
2002 Real-Time Test • Algorithm developed from 1999-2001 Sample • 2002 Real-Time Runs • Initiated at 00, 06, 12, 18 UTC • Storm positions from ATCF • Analysis restricted to storms within 700 km of AMSU data swath • Results sent to TPC via ftp • Evaluation Samples • 1999-2001 Developmental cases (N=473) • 2002 All Atlantic/East Pacific cases (N=288) • 2002 Atlantic/East Pacific cases with recon (N=64) • Ground “Truth” for Evaluation • NHC Best Track Vmax and MSLP • NHC Forecast/Advisory for wind radii
Predicted vs. “Observed” Scatter Plots for 2002 Real-Time Runs (Total and Recon-Only Samples) Vmax MSLP R34 R50 R64
Error Summary for CIRA Algorithm:Developmental, 2002 All and 2002 Recon Samples Absolute Error Variance Explained Vmax MSLP Vmax MSLP Vmax and MSLP R34 R50 R64 R34 R50 R64 R34 R50 R64
FOV 1 FOV 30 CIMSS AMSU Tropical Cyclone Algorithm • Statistical Method Based on 1999-2001 regression against recon obs • - Linear fit (R2= 0.82) • Channel 7 retrieval used to account for storms near limb • ATCF message provides RMW (Used as a proxy for anomaly size) • Independent estimates in 2002 comparable to Dvorak technique • Improved logic accounts for anomaly height, sub-sampling Resolution ~ 50km
2002 Results for Atlantic Basin Atlantic statistics for AMSU versus Recon (+/- 3 hrs) in hPa (N=63) Mean Error 3.24 Std Dev 2.29 Bias -0.42 RMSE 3.96 Avg MSLP of sample 1002.6 Compared to Dvorak (N= 60) in hPa CIMSS Dvorak Mean Error 3.24 4.52 Std Dev 2.29 3.40 Bias -0.28 -0.90 RMSE 3.95 5.62 Avg MSLP of sample 1002.4
2002 Atlantic Basin Results NOAA/NESDIS Satellite Analysis Branch (SAB) vs. AMSU (N=34, +/- 2hrs of aircraft reconnaissance) SAB 78% within +/- 0.5T AMSU 81% within +/- 0.5T
20 Mile Eye Storm on edge of satellite Swath (FOV 3)
Improve Technique • Bias correction when storm is near satellite limb • Separate treatment of pinhole eye storms using new coefficients • Time averaging / smoothing • Add channel 8 retrieval • Integrate algorithm into NHC/TPC operations • Addition of AMSU on Aqua (2 more passes per day) • Basin specific coefficients (need sufficient “observations”) Confidence Indicator • Measure Based on FOV, eye size (RMW), anomaly height Future Work
Summary AMSU provides unique tropical cyclone perspective • Penetrates cloud cover • 55 Ghz region radiances can quantify inner core thermal • structure / changes. • Temperature anomaly strength directly associated with tropical • cyclone intensity • Skill comparable to, and in some cases better than, the Dvorak estimates • An important new addition to the forecaster “tool kit”
Conclusions from 2002 Evaluation • Vmax, MSLP (CIRA): • 2002 (independent) performance very similar to (slightly improved) over dependent sample • Intensity underestimated for small-cored systems • Wind Radii (CIRA Method): • 2002 recon-only errors generally similar to dependent sample • Tendency for high bias for R50 and R64 • Observed R50 and R64 more asymmetric than predicted • Addition of second AMSU channel (CIMSS): • Accounts for variability in TC temperature anomaly height • Improvements resulting from advanced algorithm logic (CIMSS): • Based on evaluation of 3 years of estimates, continues to evolve • Additional improvements foreseen in 2003: • Characterization and new regressions for small-cored storms • JHT pathway in 2003: • Continue evaluation of 2002 performance • Implement algorithm upgrades and re-evaluate after 2003 season • If successful and approved, activate improved algorithms at TPC