Data Observability for Pipeline Design
Data Observability for Pipeline

Data Observability for Pipeline Design
E N D
Presentation Transcript
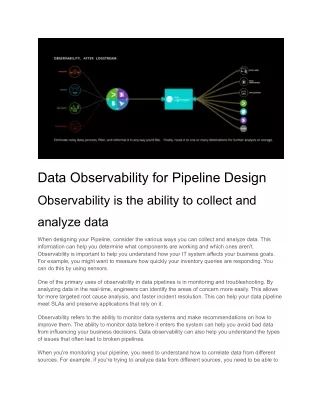
Data Observability for Pipeline Design Observability is the ability to collect and analyze data When designing your Pipeline, consider the various ways you can collect and analyze data. This information can help you determine what components are working and which ones aren't. Observability is important to help you understand how your IT system affects your business goals. For example, you might want to measure how quickly your inventory queries are responding. You can do this by using sensors. One of the primary uses of observability in data pipelines is in monitoring and troubleshooting. By analyzing data in the real-time, engineers can identify the areas of concern more easily. This allows for more targeted root cause analysis, and faster incident resolution. This can help your data pipeline meet SLAs and preserve applications that rely on it. Observability refers to the ability to monitor data systems and make recommendations on how to improve them. The ability to monitor data before it enters the system can help you avoid bad data from influencing your business decisions. Data observability can also help you understand the types of issues that often lead to broken pipelines. When you're monitoring your pipeline, you need to understand how to correlate data from different sources. For example, if you're trying to analyze data from different sources, you need to be able to
see where each data point came from and what data it contains. Then, you can take action. The data you gather can help you make better decisions. It helps identify anomalies Observability is the ability to see data and identify anomalies in your pipeline. Observability is also important in distributed systems, which must monitor performance. A significant amount of data passes through a distributed system, and detecting anomalies can reduce the time required to fix a fault. The most effective way to identify anomalies is to observe data in context. Contextual anomalies are those that are situation-specific and are common in time-series data. For example, if you observe that people spend more money on food during the holiday season, than they do in off-seasons, this is a contextual anomaly. Meanwhile, a collective anomaly is a group of data instances that do not follow the usual pattern. An anomaly detection algorithm is a powerful tool to detect abnormalities in data. It can identify outliers and flag them for further analysis. It is particularly helpful in identifying data points that are statistically different. This information can signal critical incidents such as a breaking change in an upstream source, or an architectural optimization opportunity. However, implementing an effective anomaly detection system can be a difficult task for most data organizations. An example of an anomaly detection application is the detection of spam. By identifying unusual activity in a network of accounts, an anomaly detection algorithm can flag the data and alert the appropriate authorities. It can also be used in manufacturing processes. It can flag dangerous temperatures or filter out faulty materials. Depending on the data available, it can be lifesaving. The data in a pipeline can be observed in real time. A pipeline can identify a wide range of species, even with a 10% class imbalance. It can identify anomalies based on the datasets' schemas. Even if there is a large class imbalance, an algorithm can detect the new species and cluster them. It improves data lineage Data observability helps you track data in a pipeline. It helps you understand the path of data, including where it originates, how it transforms, and where it ends up downstream. It can also help you find anomalies and errors in the data. This is useful for error resolution, data migration, and other purposes. Data lineage is essential to keep a business running. Data is collected from different sources such as research, operational systems, and more. This information needs to be processed and integrated to create business value. Data lineage provides the tracking capabilities that businesses need to ensure that their data is quality. By understanding how data moves through a pipeline, organizations can make confident decisions based on data quality. With data lineage, teams can diagnose problems with data by knowing where
it came from, who touched it, and why it changed. The ability to monitor the journey of data is crucial for ensuring a smooth and consistent flow of data. Data pipelines can experience a range of processing issues, ranging from high levels of latency to lower than expected throughput. This can lead to incomplete outputs or errors, so observing the path of data can help limit downtime. In addition, observability allows engineers to analyze root causes of data pipeline problems more efficiently. This helps ensure data pipelines meet SLAs and preserve the integrity of data-dependent applications. VISIT HERE Data engineers commonly use testing methods to identify data quality problems. However, with the growth of data consumption, this practice has become inefficient and ineffective. Tests don't provide the context necessary to understand data issues. Teams may run hundreds of tests in an attempt to cover all predictable data problems. Data observability gives teams the context they need to learn from data issues and stay one step ahead of data catastrophes. Data observability also increases data quality. It also alerts engineers to unexpected results, which leads to reduced investigation time. In addition to reducing downtime, data observability also increases trust in the data.