Download
1 / 55
550 likes | 622 Vues
This report provides an overview of recent ocean monitoring highlights in the Pacific, Arctic, Indian, and Atlantic Oceans. Includes global sea surface temperature predictions and updates on ENSO, PDO, NAO, hurricane conditions, and SST anomalies.

E N D
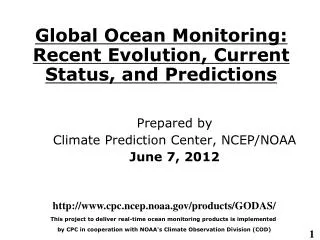
Global Ocean Monitoring: Recent Evolution, Current Status, and Predictions Prepared by Climate Prediction Center, NCEP/NOAA June 7, 2012 http://www.cpc.ncep.noaa.gov/products/GODAS/ This project to deliver real-time ocean monitoring products is implemented by CPC in cooperation with NOAA's Climate Observation Division (COD)
Outline • Overview • Recent highlights • Pacific/Arctic Ocean • Indian Ocean • Atlantic Ocean • Global SST Predictions
Overview • Pacific Ocean • ENSO was in neutral phase with NINO3.4=-0.1oC in May 2012. • A majority of dynamical models predict an El Nino developing in later summer 2012. • NOAA “ENSO Diagnostic Discussion” in June suggests “There is a 50% chance that El Niño conditions will develop during the second half of 2012“. An El Nino watch was issued. • Negative phase of PDO strengthened, with PDOI=-1.7 in May 2012. • Indian Ocean • Positive SSTA presented in the tropical and southeastern Ocean. • Atlantic Ocean • NAO switched to negative phase with NAOI=-0.9 in May 2012. • Negative SSTA in the tropical Atlantic weakened. • NOAA predicted near-normal condition of hurricane activity in 2012.
Global SST Anomaly (0C) and Anomaly Tendency • Some warming tendency presented in the central and eastern equatorial Pacific. • Negative phase of PDO associated SSTA strengthened. • Positive SSTA developed in the tropical and SE Indian Ocean. • Negative SSTA weakened along the equatorial Atlantic and a tripole-like SSTA with positive in mid-latitudes and negative in high and low latitudes was observed. • Large anomalies and tendencies emerged in the South Ocean. Fig. G1. Sea surface temperature anomalies (top) and anomaly tendency (bottom). Data are derived from the NCEP OI SST analysis, and anomalies are departures from the 1981-2010 base period means.
Positive TCHP anomalies presented in the western Pacific and negative ones in the central and eastern Pacific off the equator. • Both the anomalies and the tendencies over the Atlantic Ocean were small. • TCHP has strong seasonal cycle. TCHP field is the anomalous heat storage associated with temperatures larger than 26°C.
NOAA Predict a near-Normal Atlantic Hurricane Season in 2012 (http://www.cpc.ncep.noaa.gov/products/outlooks/hurricane.shtml http://en.wikipedia.org/wiki/Accumulated_cyclone_energy) • Low frequency: increased Atlantic hurricane activity since 1995 • Expected near-average SSTs across much of the tropical Atlantic Ocean and Caribbean Sea
Longitude-Depth Temperature Anomaly and Anomaly Tendency in 2OS-2ON Fig. G3. Equatorial depth-longitude section of ocean temperature anomalies (top) and anomaly tendency (bottom). Data are derived from the NCEP's global ocean data assimilation system which assimilates oceanic observations into an oceanic GCM. Anomalies are departures from the 1981-2010 base period means. • Positive ocean temperature anomalies occupied almost the whole equatorial Pacific. • Positive anomalies were dominated in the equatorial Indian Ocean. • Both positive and negative anomalies presented at top 150m of the equatorial Atlantic. • The warming continued in the central and eastern equatorial Pacific, except the regions along the American coast. • Ocean temperature warmed up around 50-150 m in the equatorial central Indian Ocean. • Both positive and negative tendencies were observed in the equatorial Atlantic.
Equatorial Pacific Ocean Temperature Pentad Mean Anomaly TAO GODAS • Positive anomaly more than 1oC presented near the thermocline across the equatorial Pacific with maximum center in the west. • Compared with TAO, GODAS is too warm at 100-250 m depth.
Equatorial Pacific SST (ºC), HC300 (ºC), u850 (m/s) Anomalies Fig. P4. Time-longitude section of anomalous pentad sea surface temperature (left), upper 300m temperature average (heat content, middle-left), 850-mb zonal wind (U850, middle-right) averaged in 2OS-2ON and Outgoing Long-wave Radiation (OLR, right) averaged in 5OS-5ON. SST is derived from the NCEP OI SST, heat content from the NCEP's global ocean data assimilation system, U850 from the NCEP CDAS. Anomalies for SST, heat content and U850/OLR are departures from the 1981-2010 base period pentad means respectively. • Negative SSTA weakened in the central (eastern) equatorial Pacific since Feb 2012 (Dec 2011), and positive SSTA developed in the east since Feb 2012 and weakened in May 2012. • The eastward propagation of positive HC300 anomaly in Apr-May 2012, characteristic of downwelling oceanic Kelvin wave, is probably forced by the MJO-related westerly wind anomalies in Mar 2012. • Some westerly wind anomalies presented in the W. Pacific in May 2012.
MJO activity • MJO was relatively active during Jan-Apr 2012, but it was less active since May 2012.
Tropical Pacific: SST Anom., SST Anom. Tend., OLR, Sfc Rad, Sfc Flx, 925-mb & 200-mb Winds • Overall SSTA was small in the tropical Pacific, and warming tendency was observed in the eastern and central equatorial Pacific. • Tropical convection was still enhanced in the western Pacific. • Easterly anomaly observed over the western and central equatorial Pacific at low level. • Cyclonic anomalous circulation at 200 hPa in tropical N.&S. Pacific presented in May 2012. C C Fig. P2. Sea surface temperature (SST) anomalies (top-left), anomaly tendency (top-right), Outgoing Long-wave Radiation (OLR) anomalies (middle-left), sum of net surface short- and long-wave radiation, latent and sensible heat flux anomalies (middle-right), 925-mb wind anomaly vector and its amplitude (bottom-left), 200-mb wind anomaly vector and its amplitude (bottom-right). SST are derived from the NCEP OI SST analysis, OLR from the NOAA 18 AVHRR IR window channel measurements by NESDIS, winds and surface radiation and heat fluxes from the NCEP CDAS. Anomalies are departures from the 1981-2010 base period means.
Evolution of Pacific NINO SST Indices • Nino4 and Nino3.4 remained negative, but weakened, Nino1+2 and Nino3 were positive. • Nino3.4 = -0.1oC in May 2012. • The distribution of SSTA was asymmetric between the north and south Pacific. Compared with last May, SST was much warmer in the tropical-subtropical S. Pacific in May 2012. • The indices were calculated based on OISST. They may have some differences compared with those based on ERSST.v3b. Fig. P1a. Nino region indices, calculated as the area-averaged monthly mean sea surface temperature anomalies (oC) for the specified region. Data are derived from the NCEP OI SST analysis, and anomalies are departures from the 1981-2010 base period means.
NINO3.4 Heat Budget • SSTA tendency (dT/dt) in NINO3.4 region (dotted line) was positive since mid-Jan 2012, indicating the warming tendency in the eastern and central Pacific. • All dynamical terms (Qu, Qv, Qw+Qzz) were positive and heat flux (Qq) near-normal in Apr-May 2012. • The total heat budget term (RHS) was consistent with the observed tendency (dT/dt) since mid-Mar 2012. Huang, B., Y. Xue, X. Zhang, A. Kumar, and M. J. McPhaden, 2010 : The NCEP GODAS ocean analysis of the tropical Pacific mixed layer heat budget on seasonal to interannual time scales, J. Climate., 23, 4901-4925. Qu: Zonal advection; Qv: Meridional advection; Qw: Vertical entrainment; Qzz: Vertical diffusion Qq: (Qnet - Qpen + Qcorr)/ρcph; Qnet = SW + LW + LH +SH; Qpen: SW penetration; Qcorr: Flux correction due to relaxation to OI SST
PDO index • The negative PDO index strengthened in May 2012 with PDO index =-1.7. • The apparent connection between NINO3.4 and PDO index may suggest impact of the La Nina on the North Pacific SST variability through atmospheric bridge. • However, the strengthening of negative phase of PDO in May 2012 seems not connected with the weakening Nino3.4 SSTA. • Pacific Decadal Oscillation is defined as the 1st EOF of monthly ERSST v3b in the North Pacific for the period 1900-1993. PDO index is the standardized projection of the monthly SST anomalies onto the 1st EOF pattern. • The PDO index differs slightly from that of JISAO, which uses a blend of UKMET and OIv1 and OIv2 SST.
North Pacific & Arctic Ocean: SST Anom., SST Anom. Tend., OLR, SLP, Sfc Rad, Sfc Flx • Positive (negative) SSTA presented in the central (northern) N. Pacific, consistent with the negative PDO index (previous slide). • PDO associated SSTA strengthened, largely due to net surface heat flux anomalies. • The above-normal sea level pressure near the west coast of N. America is favourable for northerly wind anomalies along the coast. Fig. NP1. Sea surface temperature (SST) anomalies (top-left), anomaly tendency (top-right), Outgoing Long-wave Radiation (OLR) anomalies (middle-left), sea surface pressure anomalies (middle-right), sum of net surface short- and long-wave radiation anomalies (bottom-left), sum of latent and sensible heat flux anomalies (bottom-right). SST are derived from the NCEP OI SST analysis, OLR from the NOAA 18 AVHRR IR window channel measurements by NESDIS, sea surface pressure and surface radiation and heat fluxes from the NCEP CDAS. Anomalies are departures from the 1981-2010 base period means.
NorthAmerica Western Coastal Upwelling Fig. NP2. Total (top) and anomalous (bottom) upwelling indices at the 15 standard locations for the western coast of North America. Upwelling indices are derived from the vertical velocity of the NCEP's global ocean data assimilation system, and are calculated as integrated vertical volume transport at 50 meter depth from each location to its nearest coast point (m3/s/100m coastline). Anomalies are departures from the 1981-2010 base period pentad means. • Anomalous upwelling dominated in May 2012. • This is consistent with anomalous northerly wind along the coast. • Area below (above) black line indicates climatological upwelling (downwelling) season. • Climatologically upwelling season progresses from March to July along the west coast of North America from 36ºN to 57ºN.
Monthly Chlorophyll Anomaly • Positive ChlorophyII anomaly presented in the most regions along the coast. • It is consistent with the above-normalupwelling along the coast. http://coastwatch.pfel.noaa.gov/FAST
Arctic Sea Ice National Snow and Ice Data Center http://nsidc.org/arcticseaicenews/index.html • In May 2012, Arctic sea ice extent was below the long-term climatology.
Evolution of Indian Ocean SST Indices • Positive SSTA presented in the tropical and SE Indian Ocean. • Compared with 2011, the equatorial and tropical S. Indian Ocean was warmer. • DMI was close to neutral since Nov 2011. Fig. I1a. Indian Ocean Dipole region indices, calculated as the area-averaged monthly mean sea surface temperature anomalies (OC) for the SETIO [90ºE-110ºE, 10ºS-0] and WTIO [50ºE-70ºE, 10ºS-10ºN] regions, and Dipole Mode Index, defined as differences between WTIO and SETIO. Data are derived from the NCEP OI SST analysis, and departures from the 1981-2010 base period means and the recent 10 year means are shown in bars and green lines.
Tropical Indian: SST Anom., SST Anom. Tend., OLR, Sfc Rad, Sfc Flx, 925-mb & 200-mb Wind Anom. • Positive SSTA presented in the tropical and SE Indian Ocean. • Negative SSTA tendency in the eastern Indian Ocean was largely due to heat flux. Fig. I2. Sea surface temperature (SST) anomalies (top-left), anomaly tendency (top-right), Outgoing Long-wave Radiation (OLR) anomalies (middle-left), sum of net surface short- and long-wave radiation, latent and sensible heat flux anomalies (middle-right), 925-mb wind anomaly vector and its amplitude (bottom-left), 200-mb wind anomaly vector and its amplitude (bottom-right). SST are derived from the NCEP OI SST analysis, OLR from the NOAA 18 AVHRR IR window channel measurements by NESDIS, winds and surface radiation and heat fluxes from the NCEP CDAS. Anomalies are departures from the 1981-2010 base period means.
Evolution of Tropical Atlantic SST Indices Fig. A1a. Tropical Atlantic Variability region indices, calculated as the area-averaged monthly mean sea surface temperature anomalies (ºC) for the TNA [60ºW-30ºW, 5ºN-20ºN], TSA [30ºW-10ºE, 20ºS-0] and ATL3 [20ºW-0, 2.5ºS-2.5ºN] regions, and Meridional Gradient Index, defined as differences between TNA and TSA. Data are derived from the NCEP OI SST analysis, and departures from the 1981-2010 base period means and the recent 10 year means are shown in bars and green lines. • SSTA in the tropical North Atlantic (TNA) was near-normal. Anomalies were consistently cooler relative to the recent 10 year means than the 30 year means, indicating impacts of warming trend on anomalies. • Tropical South Atlantic (TSA) has cooled down substantially since Dec 2011, and the cooling weakened in May 2012. • Meridional Gradient Mode index (TNA-TSA) was near-normal in May 2012. • ATL3 SSTA has been negative since Dec 2011 and weakened in May 2012. • Tropical Atlantic in May was cooler in 2012 than in 2011, except for the regions near the African coast.
Tropical Atlantic: • Negative SSTA presented and weakened in the tropical Atlantic. • Warming in Gulf of Mexico persisted. • Convections suppressed over the equatorial Atlantic.
NAO and SST Anomaly in North Atlantic Fig. NA2. Monthly standardized NAO index (top) derived from monthly standardized 500-mb height anomalies obtained from the NCEP CDAS in 20ºN-90ºN (http://www.cpc.ncep.noaa.gov). Time-Latitude section of SST anomalies averaged between 80ºW and 20ºW (bottom). SST are derived from the NCEP OI SST analysis, and anomalies are departures from the 1981-2010 base period means. • NAO switched to negative phase in May 2012, with NAOI=-0.9. • Since Jan 2012, positive (negative) SSTA developed in the mid-latitude (tropical) North Atlantic SSTA , probably due to the impact of positive phase of NAO and La Nina. • Positive SSTA along the American Atlantic coast persisted in May 2012.
North Atlantic: SST Anom., SST Anom. Tend., OLR, SLP, Sfc Rad, Sfc Flx • Positive SSTA presented in the mid-latitudes of N. Atlantic and along the American coast. • SSTA tendency showed a negative in the central and positive in surround in the N. Atlantic. • Positive (negative) SLP anomaly in the high (mid-) latitude, consisting with the switch of NAO from positive to negative phase. Fig. NA1. Sea surface temperature (SST) anomalies (top-left), anomaly tendency (top-right), Outgoing Long-wave Radiation (OLR) anomalies (middle-left), sea surface pressure anomalies (middle-right), sum of net surface short- and long-wave radiation anomalies (bottom-left), sum of latent and sensible heat flux anomalies (bottom-right). SST are derived from the NCEP OI SST analysis, OLR from the NOAA 18 AVHRR IR window channel measurements by NESDIS, sea surface pressure and surface radiation and heat fluxes from the NCEP CDAS. Anomalies are departures from the 1981-2010 base period means.
Tropical Storm Activity in Atlantic • By June 1, 2012, 2 tropical storms (ALBERTO and BERYL) were formed in the North Atlantic. The tropical cyclone heat potential (hereafter TCHP), is defined as a measure of the integrated vertical temperature from the sea surface to the depth of the 26°C isotherm.
IRI NINO3.4 Forecast Plum • A majority of dynamical models predicted an El Nino since summer 2012. • Official probabilistic forecast favors an El Nino during summer 2012 to winter 2012/2013. • NOAA “ENSO Diagnostic Discussion” in June suggests that “There is a 50% chance that El Niño conditions will develop during the second half of 2012”.
NMME (CFSv1, CFSv2, ECHAMA, ECHAMF, GFDL, NCAR, NASA) SST Forecast (ICs around May 1, 2012) (http://www.cpc.ncep.noaa.gov/products/NMME/current/plume.html) • NASA, CFSv2, GFDL, NCAR, and ECHAMA models predicted an El Nino starting in summer 2012. • ECHAMF and CFSv1 models predicted a slight warming, but no El Nino in 2012.
NCEP CFSv1 and CFSv2 NINO3.4 Forecast • Both CFSv1and PDF corrected CFSv1 predicted El Nino conditions in late summer and fall. • While CFSv2 prediction with IC in May is cooler than that of CFSv1 after summer 2012.
CFS Niño3.4 SST Predictions from Different Initial Months Fig. M1. CFS Nino3.4 SST prediction from the latest 9 initial months. Displayed are 40 forecast members (brown) made four times per day initialized from the last 10 days of the initial month (labelled as IC=MonthYear) as well as ensemble mean (blue) and observations (black). Anomalies were computed with respect to the 1981-2010 base period means. • CFSv2 prediction was warmer than CFSv1, except with IC in May,CFSv2 prediction is cooler than that of CFSv1 after summer 2012. http://origin.cpc.ncep.noaa.gov/products/GODAS/ocean_briefing_new/cfsv2_n34_sst.gif
NCEP CFSv1 and CFSv2 Tropical North Atlantic SST Forecast • CFSv1 predicted below-normal SST and CFSv2 predicted above-normal during Jun 2012-Feb 2013.
Overview • Pacific Ocean • ENSO was in neutral phase with NINO3.4=-0.1oC in May 2012. • A majority of dynamical models predict an El Nino developing in later summer 2012. • NOAA “ENSO Diagnostic Discussion” in June suggests “There is a 50% chance that El Niño conditions will develop during the second half of 2012“. An El Nino watch was issued. • Negative phase of PDO strengthened, with PDOI=-1.7 in May 2012. • Indian Ocean • Positive SSTA presented in the tropical and southeastern Ocean. • Atlantic Ocean • NAO switched to negative phase with NAOI=-0.9 in May 2012. • Negative SSTA in the tropical Atlantic weakened. • NOAA predicted near-normal condition of hurricane activity in 2012.
Projection of OTA onto EOF1 and EOF2 (2S-2N, 0-459m, 1979-2010) *EOF1: Tilt mode, driven mainly by zonal wind stress, almost in phase with ENSO *EOF2: WWV mode, associated with recharge & discharge oscillator; driven by wind curl off the equator *Tendency of WWV/EOF2 is in proportion to tilt/EOF1; EOF1 and 2 are in quadrature (Clarke et al. 2007)
Evolution of Cold Tongue, Warm Pool, and ENSO-Modoki SST Indices Modoki Index = A-0.5*(B+C)A (165E-140W, 10S-10N), B (110W-70W, 15S-5N), and C (125E-145E, 10S-20N) (Ashok et al. 2007: JGR, 112, C11007, doi: 10.1029/2006JC003798). Cold Tongue Index: Nino3-alpha*Nino4; Warm Pool Index: Nino4-alpha*Nino3; alpha=0.4 when Nino3*Nino4 >0.0 and alpha=0.0 when Nino3*Nino4 ≤ 0.0 (Ren and Jin, 2011: GRL, 38, L04704, doi: 10.1029/2010GL046031) Data are derived from the NCEP OI SST analysis, and anomalies are departures from the 1981-2010 base period means.
Evolution of Equatorial Pacific Surface Zonal Current Anomaly (cm/s)
Global SSH/HC Anomaly (cm/oC ) and Anomaly Tendency Fig. G2. Sea surface height anomalies (SSHA, top left), SSHA tendency (bottom left), top 300m heat content anomalies (HCA, top right), and HCA tendency (bottom right). SSHA are derived from http://www.aviso.oceanobs.com, and HCA from GODAS.
Warm Water Volume (WWV) and NINO3.4 Anomalies Fig. P3. Phase diagram of Warm Water Volume (WWV) and NINO 3.4 SST anomalies. WWV is the average of depth of 20ºC in [120ºE-80ºW, 5ºS-5ºN] calculated with the NCEP's global ocean data assimilation system. Anomalies are departures from the 1981-2010 base period means. • WWV is defined as average of depth of 20ºC in [120ºE-80ºW, 5ºS-5ºN]. Statistically, peak correlation of Nino3 with WWV occurs at 7 month lag (Meinen and McPhaden, 2000). • Since WWV is intimately linked to ENSO variability (Wyrtki 1985; Jin 1997), it is useful to monitor ENSO in a phase space of WWV and NINO3.4 (Kessler 2002). • Increase (decrease) of WWV indicates recharge (discharge) of the equatorial oceanic heat content. 2011/12 La Nina 2009/10El Nino 2010/11 La Nina
Recent Evolution of Equatorial Indian SST (ºC), 0-300m Heat Content (ºC), and 850-mb Zonal Wind (m/s) Anomalies Fig. I3. Time-longitude section of anomalous pentad sea surface temperature (left), upper 300m temperature average (heat content, middle-left), 850-mb zonal wind (U850, middle-right) averaged in 2OS-2ON and Outgoing Long-wave Radiation (OLR, right) averaged in 5OS-5ON. SST are derived from the NCEP OI SST, heat content from the NCEP's global ocean data assimilation system, and U850 from the NCEP CDAS. Anomalies are departures from the 1981-2010 base period pentad means.
NMME (CFSv1, CFSv2, ECHAMA, ECHAMF, GFDL, NCAR, NASA) SST Forecast (IC=201205) OND ASO http://www.cpc.ncep.noaa.gov/products/NMME/current/plume.html Thanks Qin Zhang, Huug van den Dool, Suru Saha, Malaquias Pena Mendez, Patrick Tripp, Peitao Peng and Emily Becker plus the originators at NASA, NCAR, GFDL, IRI (all coupled models) SON
NCEP CFSv1 and CFSv2 PDO Forecast • Pacific Decadal Oscillation is defined as the 1st EOF of monthly ERSSTv3b in the North Pacific for the period 1900-1993. PDO index is the standardized projection of the monthly SST anomalies onto the 1st EOF pattern.
CFS Pacific Decadal Oscillation (PDO) Index Predictions from Different Initial Months PDO is the first EOF of monthly ERSSTv3b anomaly in the region of [110oE-100oW, 20oN-60oN]. CFS PDO index is the standardized projection of CFS SST forecast anomalies onto the PDO EOF pattern. Fig. M4. CFS Pacific Decadal Oscillation (PDO) index predictions from the latest 9 initial months. Displayed are 40 forecast members (brown) made four times per day initialized from the last 10 days of the initial month (labelled as IC=MonthYear) as well as ensemble mean (blue) and observations (black). Anomalies were computed with respect to the 1981-2010 base period means.
NCEP CFSv1 and CFSv2 Indian Ocean Dipole Model Index Forecast DMI = WTIO- SETIO SETIO = SST anomaly in [90oE-110oE, 10oS-0] WTIO = SST anomaly in [50oE-70oE, 10oS-10oN]