Hypothesis Testing: Chi-Squared Analysis of Color Distributions
Analyze if observed M&M colors match claimed distribution using chi-squared tests. Learn test of independence, homogeneity, and expected frequencies.

Hypothesis Testing: Chi-Squared Analysis of Color Distributions
E N D
Presentation Transcript
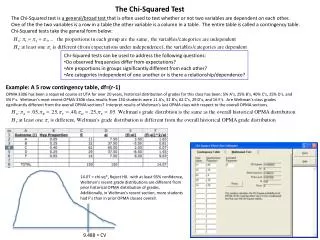
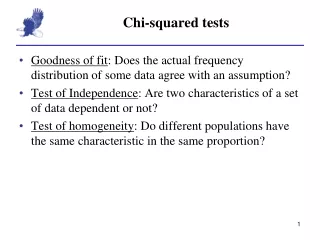
Chi-squared tests • Goodness of fit: Does the actual frequency distribution of some data agree with an assumption? • Test of Independence: Are two characteristics of a set of data dependent or not? • Test of homogeneity: Do different populations have the same characteristic in the same proportion?
Goodness-of-Fit Test • Test the hypothesis that an observed frequency distribution fits some claimed distribution • Example: The distribution of colors in a bag of M&M’s is the same • Another example: The distribution of colors in a bag of M&M’s is the following: • 30% Brown 10% Green • 20% Red 10% Blue • 20% Yellow 10% Orange
Hypothesis Testing • Categories have equal frequencies • H0: p1 = p2 = p3 = . . . = pk • H1: at least one of the probabilities is different • Categories have unequal frequencies • H0 : p1 , p2, p3, . . . , pk are as claimed • H1 : at least one of the above proportions is not the claimed value
Expected Frequencies • Claim: The distribution of colors is the same: • First, we collect our sample (Observed frequency) • Next, we calculate our Expected frequency: • If all expected frequencies are equal: • If all expected frequencies are not all equal: • Each category’s expected frequency is the product the total and the category’s probability
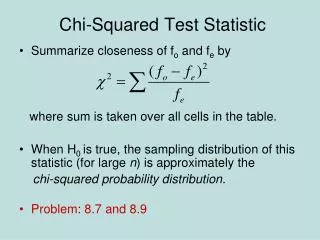
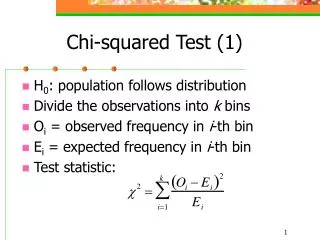
Test Statistics and Critical Values • Test Statistic:
Critical Values in Chi Square table • Heading: Alpha • Goodness-of-fit hypothesis tests are always right-tailed. • Degrees of freedom: number of categories minus 1 Fail to Reject Reject 0
Uneven Distribution Example • Mars claims its M&M candies are distributed with the color percentages of 30% brown, 20% yellow, 20% red, 10% orange, 10% green, and 10% blue. • At the 0.05 significance level, test the claim that the color distribution is as claimed by Mars, Inc. • H0 (and claim): p1 = 0.30, p2 = 0.20, p3 = 0.20, p4 = 0.10, p5 = 0.10, p6 = 0.10 • H1: At least one of the proportions is different from the claimed value.
Uneven Distribution • Test statistic • Critical Value
Fail to Reject Reject = 0.05 0 Locating the test statistic
For example • Even distribution: • The population of South students is evenly distributed among the four classes • Uneven distribution: • The population of South students is distributed as follows: • 15% Lincroft 15% River Plaza • 20% Nut Swamp 20% Navesink • 20% Leonard 5% Village • 5% Private
Your Turn Claim: students’ favorite month is equally distributed throughout the year
Your Turn, again • Claim: students’ favorite colors distribution are are 25% green, 25% blue, and 10% the remaining colors