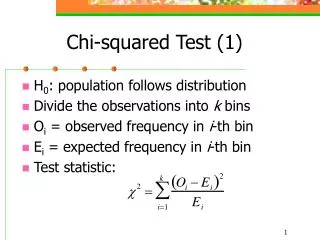
Chi-squared Test
Explore application areas, examples, limitations, and conclusion of the Chi-squared Test in statistics. Understand how to apply it to qualitative data and interpret results accurately.

Chi-squared Test
E N D
Presentation Transcript
Chi-squared Test Minhaz Fahim Zibran 31st October 2007
Outline • Application areas • Illustration with example • Limitations • Conclusion and QA Chi-squared Test
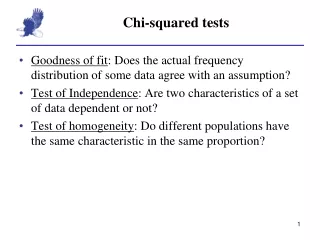
Application Areas Illustration with Example Limitations Conclusion and QA Application Application Areas • Qualitative data classified into discrete categories. Example: We have the number of men and women died from tuberculosis of respiratory system and other types of tuberculosis. Question: Is death caused by tuberculosis of respiratory system and other types of tuberculosis is dependent on gender? Chi-squared Test
Application Areas Illustration with Example Limitations Conclusion and QA Example1 An Example:* Observed Frequencies Table 1*: Observed frequencies of deaths from tuberculosis in England and Wales in 1956 *This example and data are taken from A. E. Maxwell. Analysing Qualitative Data. 4th Edition. Chapman and Hall Ltd., 1971.Library of Congress Catalog Card Number 75-10907. Chi-squared Test
Application Areas Illustration with Example Limitations Conclusion and QA Example2 Computing Expected Frequencies Table 2*: Table 1 with interior cells replaced by letters *This example and data are taken from A. E. Maxwell. Analysing Qualitative Data. 4th Edition. Chapman and Hall Ltd., 1971.Library of Congress Catalog Card Number 75-10907. Chi-squared Test
Application Areas Illustration with Example Limitations Conclusion and QA Example3 Computing Expected Frequencies Table 2*: Table 1 with interior cells replaced by letters • Proportion of deaths (including males and females) due to tuberculosis of respiratory system and other types of tuberculosis: • The expected values E1 and E2 must be chosen in such a way that the following holds. *This example and data are taken from A. E. Maxwell. Analysing Qualitative Data. 4th Edition. Chapman and Hall Ltd., 1971.Library of Congress Catalog Card Number 75-10907. Chi-squared Test
Application Areas Illustration with Example Limitations Conclusion and QA Example4 Expected Frequencies Table 3*: Expected frequencies on the assumption of independent classification *This example and data are taken from A. E. Maxwell. Analysing Qualitative Data. 4th Edition. Chapman and Hall Ltd., 1971.Library of Congress Catalog Card Number 75-10907. Chi-squared Test
Application Areas Illustration with Example Limitations Conclusion and QA Example5 Null Hypothesis Table 1*: Observed frequencies of deaths from tuberculosis in England and Wales in 1956 Table 3*: Expected frequencies on the assumption of independent classification • Null Hypothesis: “The number of men and women died in 1956 due to tuberculosis of • respiratory system and other types of tuberculosis is independent of their sex.” *This example and data are taken from A. E. Maxwell. Analysing Qualitative Data. 4th Edition. Chapman and Hall Ltd., 1971.Library of Congress Catalog Card Number 75-10907. Chi-squared Test
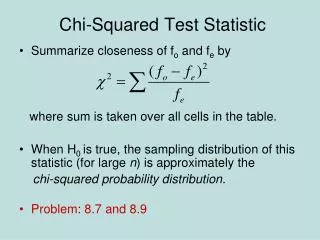
Application Areas Illustration with Example Limitations Conclusion and QA Example6 Computing Chi-square • Produce chi-square value using the formula *This example and data are taken from A. E. Maxwell. Analysing Qualitative Data. 4th Edition. Chapman and Hall Ltd., 1971.Library of Congress Catalog Card Number 75-10907. Chi-squared Test
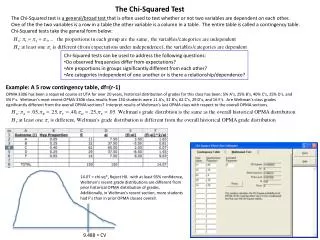
Application Areas Illustration with Example Limitations Conclusion and QA Example7 Consulting Chi-square Table • Determine degree of freedom (df) • df = (r - 1)(c - 1) • = (2 – 1) (2 - 1) = 1 • Chi-square Value • X2 = 101.35 Table 4*: Percentage of chi-square distribution • Result of Test: our null hypothesis is rejected *Part of the chi-square table is presented here. The table with more values may be found in books on statistics. The full table may be found in Table 8 of Biometrika Tables of Statisticians, vol. 1, Biometrika Trustees. Chi-squared Test
Application Areas Illustration with Example Limitations Conclusion and QA Limitations Limitations of Chi-square Test • Limitations: Applicable to only qualitative data grouped into categories, or labeled using nominally scaled variables Restricted to be applied for large samples. Fits well when expected frequencies are higher than 5. • Remedy: • Correction of continuity known as ‘Yates Correction’ • Fisher’s Exact Test Chi-squared Test
Application Areas Illustration with Example Limitations Conclusion and QA Conclusion Conclusion Chi-square test tells us whether the classifications are dependent or not. If it tells that the classifications are dependent, it does NOT necessarily imply any causal relationship. Chi-squared Test
Application Areas Illustration with Example Limitations Conclusion and QA Question Any Question? Questions Chi-squared Test