Download
1 / 41
410 likes | 433 Vues
Explore energy flow in ecosystems, trophic levels, primary productivity, and biogeochemical cycles. Discover the factors influencing Earth's primary productivity and the efficiency of energy transfer between trophic levels.

E N D
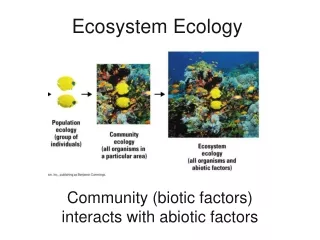
Ecosystem: • The organisms in a particular area and the physical environment with which they interact. • All the biotic and abiotic factors in a community. (Abiotic factors: energy, water, carbon, nitrogen, phosphorous)
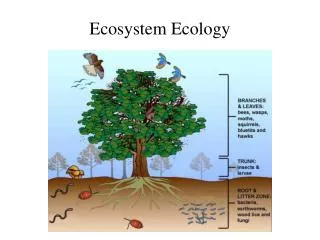
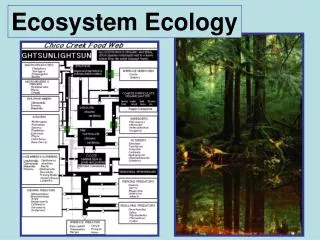
Fig. 55-4 Tertiary consumers Microorganisms and other detritivores Secondary consumers Primary consumers Detritus Primary producers Heat Key Chemical cycling Sun Energy flow
Energy Flow through Ecosystems • Energy flows through ecosystems as organisms capture and store energy, then transfer it to organisms that eat them. • These organisms are grouped into trophic levels...
Trophic Levels: Route of energy flow • food chain • food web - pyramid of numbers
Question: “Why are big fierce animals rare?” Charles Elton, 1927
Answer: Because of the way energy flows through communities...
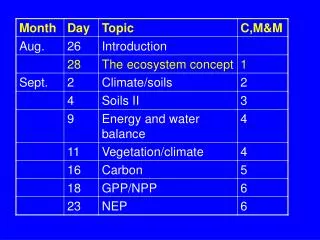
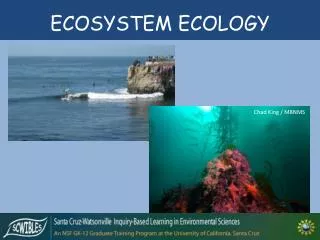
Ecosystem Energy Budgets: Primary Productivity (PP) Secondary Productivity (SP1, SP2…)
Primary Productivity (PP) • Rate at which energy or biomass is produced • per unit area by plants (primary producers) • Photosynthesis powers primary productivity. • The annual productivity of an area is determined primarily by sunlight, temperature, and moisture.
Which of these ecosystems accounts for the largest amount of Earth’s primary productivity? • Tundra • Savannah • Salt marsh • Open ocean • Tropical rainforest
Distribution of Primary Terrestrial Production Worldwide Figure 56.5 Figure 56.5
Positive Correlation Between Productivity and... Temperature Precipitation
Fig. 55-8 3,000 Tropical forest · 2,000 Net primary production (g/m2·yr) Temperate forest 1,000 Mountain coniferous forest Desert shrubland Temperate grassland Arctic tundra 0 0 500 1,500 1,000 Actual evapotranspiration (mm H2O/yr)
Secondary Productivity (SP1, SP2…) • rate of production of new biomass from PP by heterotrophic organisms (primary and secondary consumers) • positively correlated with rainfall...
Fig. 55-10 Tertiary consumers 10 J Secondary consumers 100 J Primary consumers 1,000 J Primary producers 10,000 J 1,000,000 J of sunlight
Fig. 55-9 Plant material eaten by caterpillar 200 J 67 J Cellular respiration 100 J Feces 33 J Growth (new biomass)
Ecological Efficiency: Percent of energy transferred from one trophic level to the next.
Three categories of transfer efficiency are required to predict energy flow from PP to SP1 to SP2... consumption efficiency assimilation efficiency production efficiency
1) consumption efficiency (CE) % of total productivity at one trophic level that is consumed by the next highest level (remainder not eaten)
Green World Hypothesis • Plants have many defenses against herbivores
2) assimilation efficiency (AE) % of ingested food energy that is assimilated (i.e. digested), and thus potentially available for growth, reproduction (remainder lost as feces)
AE is higher in carnivores (~80%) than in herbivores (20-50%). WHY? • Carnivores chew their food more. • Herbivores chew their food more. • Plant tissues are not as easy to digest as meat. • Meat is not as easy to digest as plant tissues.
3) production efficiency (PE) % of assimilated energy that is incorporated into new biomass (growth, reproduction) (remainder lost as respiratory heat)
PE of endotherms (<10%) is lower than PE of ectotherms (30-40%). WHY? • Because endotherms have feathers and fur. • Because endotherms move more quickly than ectotherms. • Because ectotherms move more quickly than endotherms. • Because ectotherms get energy from the sun.
SP1 is the % of PP that is incorporated at the • next highest trophic level… • SP2 is the % of SP1 that is incorporated at the • next highest trophic level… This is NEVER 100%.
Energy loss at each trophic level limits the • length of a food chain... And that is why big fierce animals are rare!
Biogeochemical Cycles Atmosphere Living Organisms + Detritus Lithosphere Hydrosphere
In studying cycling of water, carbon, nitrogen, and other chemicals, ecologists focus on four factors: • Biological importance of each chemical • Major reservoirs for each chemical • Forms in which each chemical is available or used by organisms • Key processes driving movement of each chemical through its cycle
The Water Cycle • Water is essential to all organisms • 97% in the oceans • 2% in glaciers and polar ice caps • 1% in lakes, rivers, and groundwater • Evaporation, transpiration, condensation, precipitation, and movement through surface and groundwater
The Carbon Cycle • Carbon-based organic molecules are essential to all organisms • Carbon reservoirs include fossil fuels, soils, solutes in oceans, plant and animal biomass, and the atmosphere • CO2 taken up via photosynthesis and released via respiration • Volcanoes and burning of fossil fuels contribute CO2 to atmosphere (2.9 B metric tons/yr)
14.9 390 Greenhouse Gases and Global Warming 14.8 380 14.7 14.6 370 Temperature 14.5 360 14.4 14.3 350 CO2 concentration (ppm) Average global temperature (ºC) 14.2 340 14.1 CO2 330 14.0 13.9 320 13.8 310 13.7 13.6 300 1960 1965 1970 1975 1980 1985 1990 1995 2000 2005 Year
The Nitrogen Cycle • Nitrogen is a component of amino acids, proteins, and nucleic acids • Main reservoir of nitrogen is in atmosphere (N2) • N2 converted to NH3 via nitrogen-fixing bacteria • NH3 decomposed to NH4+, which can be decomposed to NO3– by nitrifying bacteria; both assimilated by plants • Denitrifying bacteria convert NO3– back to N2
How Bears Feed Salmon to the Forest • The run of salmon leads to a major flow of nutrients into estuaries and coastal watersheds
Bears catch salmon in river and consume them in forest; on average, half the carcass is not eaten. • Bears’ fat tissue is virtually nitrogen-free, so most of nitrogen in salmon protein is excreted as urine and feces.
Nitrogen 14 from atmosphere • Nitrogen 15 from salmon • Measurements of nitrogen isotope ratios in tree rings shows that nitrogen from salmon is incorporated into trees and enhances their growth