Ecosystem Ecology
Ecosystem Ecology. Ecosystem Ecology I. Introduction - Ecosystem: an assemblage of organisms, together with their chemical and physical environments. Ecosystem Ecology I. Introduction II. Energy Flow. Ecosystem Ecology I. Introduction II. Energy Flow A. Productivity.

Ecosystem Ecology
E N D
Presentation Transcript
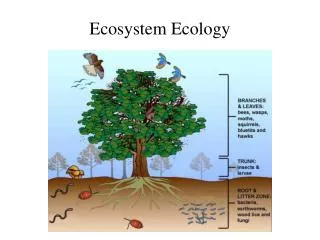
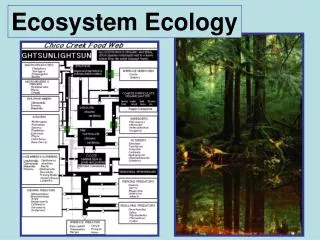
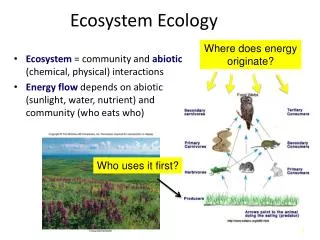
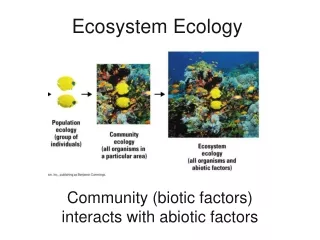
Ecosystem Ecology • I. Introduction • - Ecosystem: an assemblage of organisms, together with their chemical and physical environments
Ecosystem Ecology I. Introduction II. Energy Flow
Ecosystem Ecology I. Introduction II. Energy Flow A. Productivity 1. Gross Primary Productivity Total photosynthetic productivity: CO2 + H20 -----> Glucose + O2
Ecosystem Ecology I. Introduction II. Energy Flow A. Productivity 1. Gross Primary Productivity Total photosynthetic productivity: CO2 + H20 -----> Glucose + O2 Metabolism Growth Reproduction
Ecosystem Ecology I. Introduction II. Energy Flow A. Productivity 1. Gross Primary Productivity Total photosynthetic productivity: CO2 + H20 -----> Glucose + O2
Ecosystem Ecology I. Introduction II. Energy Flow A. Productivity 2. Net Primary Productivity: - energy stored in biomass RESPIRATION ------ Metabolism Growth GPP NPP Reproduction
Ecosystem Ecology I. Introduction II. Energy Flow A. Productivity 2. Net Primary Productivity: - energy stored in biomass - measurements
Ecosystem Ecology I. Introduction II. Energy Flow A. Productivity 2. Net Primary Productivity: - energy stored in biomass - measurements - factors affecting NPP
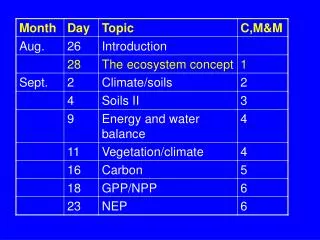
Ecosystem Ecology I. Introduction II. Energy Flow A. Productivity 2. Net Primary Productivity: - energy stored in biomass - measurements - factors affecting NPP - light
Ecosystem Ecology I. Introduction II. Energy Flow A. Productivity 2. Net Primary Productivity: - energy stored in biomass - measurements - factors affecting NPP - light - water
Ecosystem Ecology I. Introduction II. Energy Flow A. Productivity 2. Net Primary Productivity: - energy stored in biomass - measurements - factors affecting NPP - light - water - temp
Ecosystem Ecology I. Introduction II. Energy Flow A. Productivity 2. Net Primary Productivity: - energy stored in biomass - measurements - factors affecting NPP - light - water - temp - nutrients
2. Net Primary Productivity: - factors affecting NPP - Nutrients: Nutrient Use Efficiency = grams of dry mass produced/gram of nutrient absorbed Lower NUE for a nutrient means it is more limiting (need more to produce the same biomass).
2. Net Primary Productivity: - energy stored in biomass - measurements - factors affecting NPP - light - water - temp - nutrients - Global Patterns
2. Net Primary Productivity: - energy stored in biomass - measurements - factors affecting NPP - light - water - temp - nutrients - Global Patterns
Ecosystem Ecology I. Introduction II. Energy Flow A. Productivity 3. Net Secondary Productivity - assimilations efficiencies – A/I seed eaters: 60-80% browsers: 30-40% detritivores: 15%
Ecosystem Ecology I. Introduction II. Energy Flow A. Productivity 3. Net Secondary Productivity - assimilations efficiencies – A/I seed eaters: 60-80% browsers: 30-40% detritivores: 15% herbivores: 60-70% carnivores: 80-90%
Low AE? Must eat more to get energy needed. Horse – ‘hindgut ruminant’ – less efficient, high throughput Cattle – ‘foregut ruminant’ – more efficient, can eat less.
Ecosystem Ecology I. Introduction II. Energy Flow A. Productivity N:P :: 50:1 3. Net Secondary Productivity - affected by nutrient ratios, growth rates, and most limiting variable. May need to eat a lot to get enough of the limiting variable. N:P :: 15:1 Fast growing; need higher ratio of Phosphorus for DNA synthesis.
Ecosystem Ecology I. Introduction II. Energy Flow A. Productivity 3. Net Secondary Productivity - Net Production Efficiency = P/A
NSP What might this depend on??? NPP
0.5% Birds Ecosystem Ecology I. Introduction II. Energy Flow A. Productivity 0.7% Shrews 3. Net Secondary Productivity - net production efficiency = P/A 6-10% Most Mammals Up to 75% for sedentary poikilotherms
Ecosystem Ecology • I. Introduction • II. Energy Flow • Productivity • Trophic Pyramids
Ecosystem Ecology • I. Introduction • II. Energy Flow • Productivity • Trophic Pyramids • - ecological efficiency: NSP/NPP (5-20%) NPP of Secondary Carnivores Loss due to 2nd Law NPP of Primary Carnivores NPP of HERBIVORES NPP of Producers (PLANTS)
a. trophic "pyramids" This is why large carnivores are RARE, and why they have large RANGES NPP of Secondary Carnivores Loss due to 2nd Law NPP of Primary Carnivores NPP of HERBIVORES NPP of Producers (PLANTS)
Ecosystem Ecology • I. Introduction • II. Energy Flow • Productivity • Trophic Pyramids • DetritalFoodchains Predators Herbivores
Ecosystem Ecology • I. Introduction • II. Energy Flow • Productivity • Trophic Pyramids • DetritalFoodchains NPP Detritivores Herbivores Temperate forest: 1.5% - 2.5% Old-field Habitat: 12% Plankton: 60-99%
Ecosystem Ecology • I. Introduction • II. Energy Flow • Productivity • Trophic Pyramids • DetritalFoodchains • ‘Biomass Accumulation Ratios’ If we know the mean ‘standing crop’ of biomass from year to year, and we know the net productivity, we can calculate how long, on average the biomass persists: BAR (per year) = (biomass/m2) / (np of biomass / m2 / yr)
Ecosystem Ecology • I. Introduction • II. Energy Flow • Productivity • Trophic Pyramids • DetritalFoodchains • ‘Biomass Accumulation Ratios’ If we know the mean ‘standing crop’ of biomass from year to year, and we know the net productivity, we can calculate how long, on average the biomass persists: BAR (per year) = (biomass/m2) / (np of biomass / m2 / yr) Forests: ~ 20 years Tropical leaf litter: 3 months Phytoplantkon: ~20 days Temperate leaf litter: 2-20 years
Ecosystem Ecology • I. Introduction • II. Energy Flow • Productivity • Trophic Pyramids • DetritalFoodchains • BAR • Human Concerns
E. Human Concerns 500% increase in 50 years, with population increase of 250%
E. Human Concerns A doubling of meat production per capita
E. Human Concerns 25% of catch by weight discarded
E. Human Concerns 6-10 lbs of feed for 1 lb increase in cattle weight 2-5 lbs of fish meal for 1 lb increase in farmed fish weight
Edible kilocalories produced from kilocalories of energy required for cultivation are: 18.1% for chicken, 6.7% for grass-fed beef, 5.7% for farmed salmon 0.9% for shrimp. 123% for potatoes 250% for corn 415% for soy input calories converted to calories able to be utilized by humans E. Human Concerns So, for every 100 calories of energy we put in to raise chickens, we get 18 calories of energy produced in chicken meat. 100 cal into soy, 415 calories out.
E. Human Concerns Food production, per capita (400 kg per year is healthy minimum)
E. Human Concerns EXTENSIFICATION – MORE AREA
E. Human Concerns EXTENSIFICATION – MORE AREA
E. Human Concerns The best land has already been used; further expansion in marginal areas is costly and requires more supplementation
E. Human Concerns 47% of historical forested land has been cut
E. Human Concerns INTENSIFICATION