Download
1 / 15
150 likes | 186 Vues
Dive into the complexities of health inequalities across countries and societies, analyzing patterns, searching for explanations, and examining the impact of social disparities on health outcomes. Understand terms like health inequality, disparity, and inequity, and explore factors influencing health disparities across different social strata. This insightful journey uncovers data, trends, and disparities in global health that prompt critical discussions and actions to address health inequities.

E N D
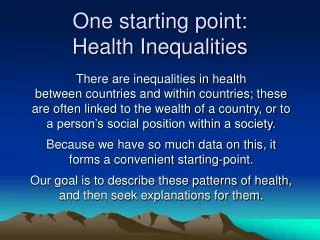
One starting point:Health Inequalities There are inequalities in health between countries and within countries; these are often linked to the wealth of a country, or to a person’s social position within a society. Because we have so much data on this, it forms a convenient starting-point. Our goal is to describe these patterns of health, and then seek explanations for them.
Some terms • Health inequality: generic term referring to systematic differences in health between groups of people, including those that arise naturally and others whose origins lie in social disadvantage. • Health disparity: subset of inequalities that are probably systematic & arise from social or other disadvantage that may in theory be correctable. • Health inequity: subset of disparities that are deemed unfair or that stem from an injustice. (Differences in health across age groups may be an inequality; differences across racial groups could be an inequity) (Note you will find somewhat different usage in the US & British literature)
Among poorer countries, infant mortality is very sensitive to variations in GNP, but does not vary above about GNP $10,000 per year.Different processes operate in poor and rich countries. Source: 1998 World Bank Report International Comparisons
Deaths per 1000 population Major Finding: Our health is certainly improving!Crude and age-standardized mortality rates, Canada, 1920-2000
2 3 4 5 1 2 3 4 5 Income adequacy quintiles But health still varies along a social gradient in rich countries; Lower income Canadians live shorter lives than rich ones.Remaining life expectancy at age 25 in Canada by sex and income quintile,non-institutionalized population, 1991 to 2001 Women Men
Potential Years of Life Lost (All Causes) England & Wales, 1971 – 1991Message: overall mortality rates fell over the 20 years, but the class inequality remained. There is a gradient, but the major deficit is for the lowest class. Occupational Class V IV III n, m II I
Why? Maybe occupation influences health? • Unemployment & health • RR 2.1 with 5-year total mortality (Morris) • 10% rise in unemployment → 1.2% mortality rise (Brenner) • Some occupations imply direct exposures & hazards; behaviors also implicated (not wearing protective gear) • Stress & Strain. Karasek’s hypothesis: Low control over work + high demand → strain • Whitehall study: low control gave OR = 1.9 for CVD
Yes, but it’s not only occupation: same pattern holds for income, education – whatever indicator you use.It’s more general.
Cumulative fetal and infant mortality over time, by maternal education, Québec, 1990-91 Message: there is an almost two-fold gradient across educational groups. Deaths per 1000 total births Weeks since conception Source: Russ Wilkins, Statistics Canada
Absolute, or relative wealth? The previous slides showed levels of health by levels of social status. But is it absolute status (amount of wealth, prestige, power) that counts, or is it relative status? I.e., in a society where few people are actually starving, there is still a SES-health gradient, so does one’s rank order (as opposed to actual $ wealth) somehow matter? This is the theme of income inequality: how wide is the spread in wealth within a society?
One measure of Income Inequality: Gini Coefficient L(s) lies below line of equality when income inequality favours the rich Gini coefficient is twice the area between the curve and the line of equality It is about 0.32 for Canada (2006) % of income 100 L(s) 0 100 % of population
Gini coefficients for the World Source: Wikipedia http://en.wikipedia.org/wiki/File:Gini_Coefficient_World_CIA_Report_2009.png
Income Inequality and Life Expectancy in 23 wealthy countries(Data from Equality Trust www.equalitytrust.org.uk) Japan Sweden Canada Spain Is Australia CH F Norway Belgium Italy Austria NL D UK Greece Singapore NZ Finland USA Ireland Denmark Portugal (r = –0.4) CH–Switzerland D–Germany Is–Israel NL-Netherlands NZ–New ZealandUK–United Kingdom USA-United States of America
Occupational Class Differences in IMR in England & Wales, Compared to SwedenOK: so what on earth is Sweden doing differently? Deaths per 1000live births England & Wales Sweden
Issues to be discussed in the course • Technical: which health indicators to use? Which indicators of social status? • Scale of analysis seems very important: individual, community, or societal? • Is SES merely a proxy for familiar risk factors? • What approaches to explanation? How to blend the narrative and the scientific? • The hierarchy of disciplines: how to harmonize inputs from different disciplines studying different aspects of the overall picture?